Table of contents
Вступ: про що це все?
У підручнику наведено короткий огляд шкоди навколишньому середовищу, якого може завдати програмне забезпечення, та того, як екомітка Blue Angel — офіційна мітка захисту навколишнього середовища уряду Німеччини — надає у ваше розпорядження інструменти виміру дизайну програмного забезпечення для сталого розвитку.
«Blue Angel» присуджується низці продуктів і послуг, від побутових мийних засобів до дрібної побутової техніки та будівельних виробів. У 2020 році Німецьке агентство з охорони навколишнього середовища розширило критерії нагородження, включивши до них програмні продукти. Це була перша у світі екологічна сертифікація, яка поєднала прозорість та автономію користувача – два стовпи вільного програмного забезпечення з відкритим вихідним кодом (FOSS) – зі сталим розвитком.
На цьому етапі ви можете поставити питання: як взагалі співвідносяться сталий розвиток та програмне забезпечення? Як щось таке, здавалося б, несуттєве, як програмне забезпечення, може мати вплив на навколишнє середовище? У цьому підручнику ми докладніше розглянемо деякі способи, якими програмне забезпечення сприяє кліматичній кризі, та як може допомогти дотримання критеріїв екологічної сертифікації програмного забезпечення «Blue Angel».
Книгу поділено та три частини:
- Частина I: Вплив програмного забезпечення на навколишнє середовища
- Частина II: Екосертифікація програмного забезпечення для робочих станцій
- Частина III: Виконання критерії нагородження Blue Angel
У той час як у Частині I досліджується чому, а в Частині II — що таке екосертифікації програмного забезпечення, у Частині III обговорюємо як, пояснюючи, що вам потрібно знати, щоб виміряти споживання енергії вашим програмним забезпеченням та подати заявку на екомаркування «Blue Angel». Зокрема, у цьому розділі ми надаємо покрокове керівництво щодо виконання азбуки критеріїв нагородження: (A) Ефективність використання ресурсів та енергії, (B) Потенційний термін служби обладнання та (C) Автономність користувача.
Частина I: Вплив програмного забезпечення на навколишнє середовища

У 2021 році Асоціація обчислювальної техніки (ACM), найстаріше науково-освітнє обчислювальне товариство у світі, опублікувала звіт Ради з технологічної політики під назвою «Обчислювальна техніка та зміна клімату». Серед інших висновків, у звіті досліджується експоненційне зростання споживання енергії та ресурсів штучним інтелектом, а також пристроями, з'єднаними з інтернетом, як у виробництві, так і у користуванні. Оцінки звіту вражають. Тільки у 2021 році, за оцінками, сектор інформаційно-комунікаційних технологій (ІКТ) давав від 1,8 до 3,9% світових викидів вуглецю. Для порівняння, це на рівні світової авіаційної промисловості, яка, за оцінками, дала 2,5% усіх викидів. У звіті висловлено попередження, що якщо нічого не змінити, до 2050 року викиди вуглецю, пов'язані з сектором ІКТ, зростуть до понад 30% усіх викидів у світі.

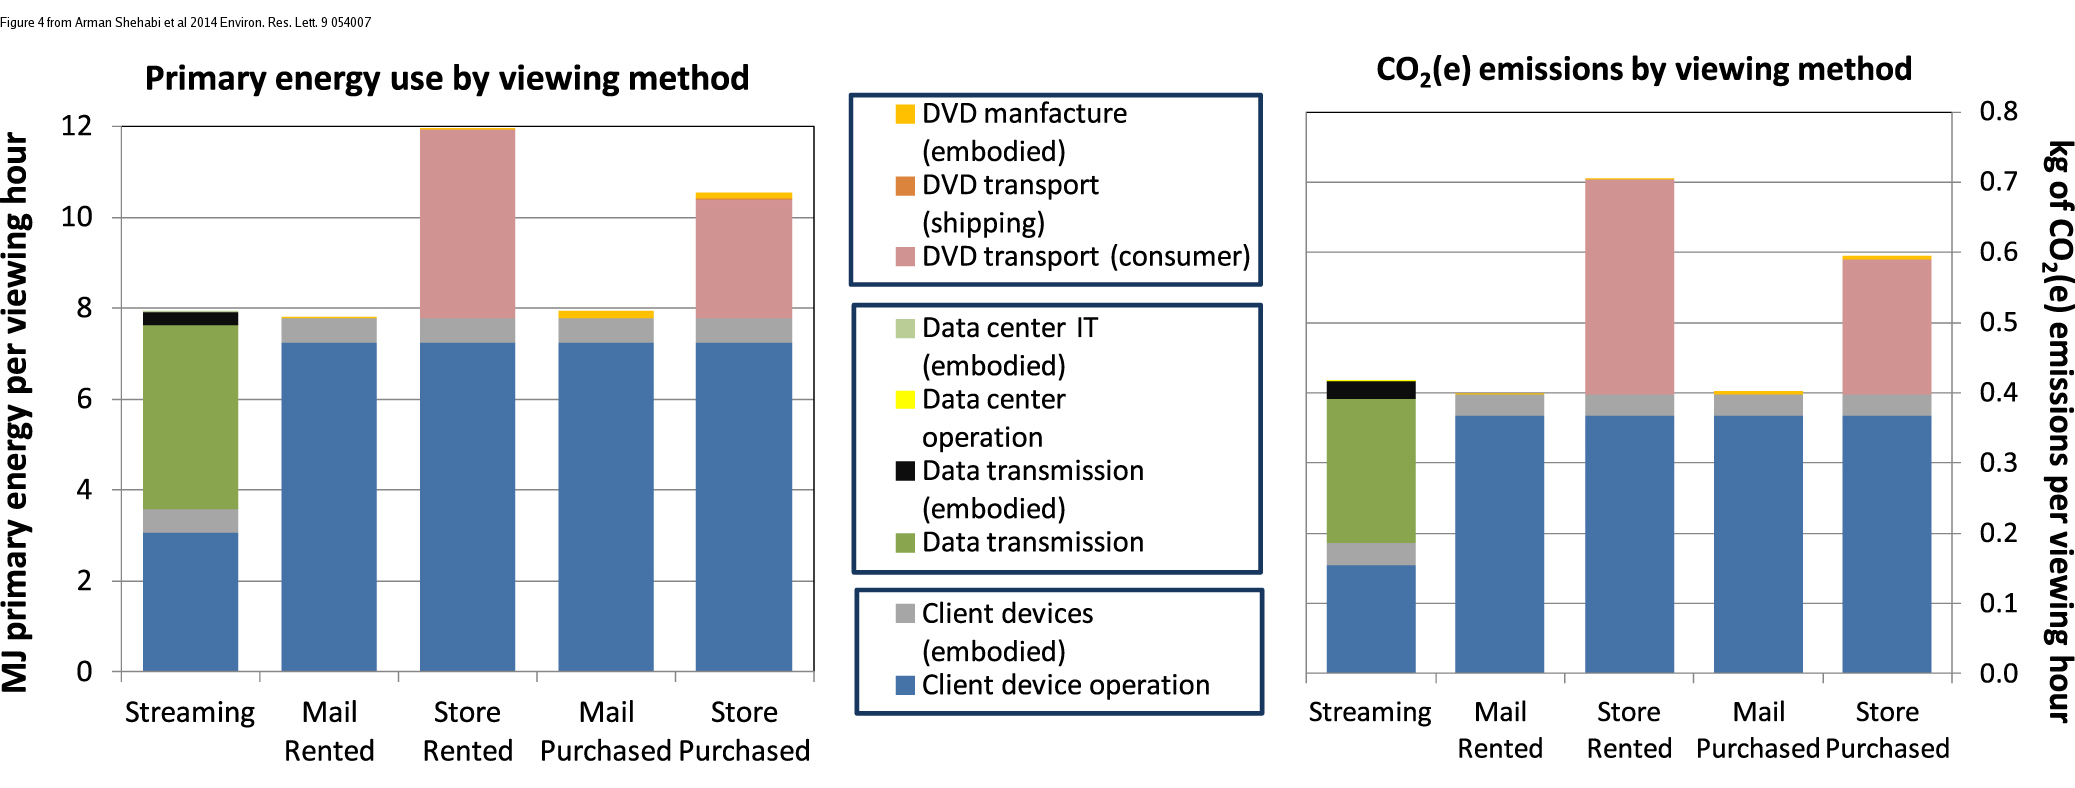
У своїх висновках автори визнають невід'ємну суперечність цифровізації: цифрові технології «можуть допомогти пом'якшити зміну клімату», але вони «спочатку повинні перестати сприяти цьому» (с. 1). ІКТ революціонізували те, як ми живемо, і їх часто хвалять за те, що вони привносять зручність та ефективність у наше повсякденне життя. Компанії використовували цифрові технології для ефективного розподілу всіляких споживчих товарів та дематеріалізації товарів повсякденного вжитку. Такі транспортні засоби, як автомобілі, скутери та велосипеди, легко доступні для оренди через програми для смартфонів, що усуває необхідність для людей володіти ними, щоб користуватися ними. Широке поширення можливостей потокового відео означає, що не потрібно виготовляти або транспортувати DVD- та Blu-ray диски для перегляду фільму, а спалювати паливо, щоб доїхати до пункту прокату, щоб придбати один із них у суботу ввечері, – це вже минуле. Електронні книги замінили цілі книжкові полиці. Через глобальну пандемію SARS-CoV-2, яка прискорює інтеграцію цифрових технологій у всі аспекти повсякденного життя, відеоконференції замінюють заходи, які колись (майже) виключно проводилися особисто, включаючи офісні зустрічі, міжнародні академічні конференції, місцеві фортепіанні концерти та навіть перші побачення… і все це тепер можливо, не виходячи з дому за допомогою пристрою, з'єднаного з інтернетом.
Незважаючи на всі способи, якими технологічний розвиток, здавалося б, зробив наше життя менш матеріальним і менш марнотратним, а отже, зручнішим та ефективнішим, може здатися, що швидкі темпи цифровізації приносять більше користі, коли йдеться про досягнення цілей сталого розвитку, ніж шкоди.
Але чи насправді все це актуальне?
Інтернет та пристрої, які ми використовуємо для встановлення з ним з'єднання, потребують інфраструктури — реального, фізичного обладнання, яке потребує енергії та споживає ресурси. Часто не враховується вплив на навколишнє середовище, наприклад, заводів, які виробляють ці пристрої, або інфраструктури, що охоплює континенти та забезпечує глобальний зв'язок. Все це вимагає енергії для щоденного використання. Більше того, обладнання, яке більше не використовується, або потрапляє до центрів утилізації для переробки після закінчення терміну служби (що вимагає ще більше енергії), або як електронні відходи, які є токсичними як для людей, так і для навколишнього середовища. Потім виробляються та транспортуються нові пристрої, в багатьох випадках без потреби.
«Ще рідше цінується той факт, що ключем до підвищення енергоефективності та захисту природних ресурсів є не апаратне забезпечення, а, перш за все, програмне забезпечення». — Критерії премії «Blue Angel»: [Ресурсо- та енергоефективні програмні продукти] (https://produktinfo.blauer-engel.de/uploads/criteriafile/en/DE-UZ%20215-202001-en-Criteria-V2.pdf) (с. 5)
У цій ширшій картині може бути недооцінена критична роль програмного забезпечення у завданні шкоди навколишньому середовищу. Дійсно, у багатьох випадках саме програмне забезпечення визначає споживання енергії та термін служби цифрової інфраструктури. У цьому підручнику докладно розглянуто деякі способи, якими цифрові технології сприяють завданню шкоди навколишньому середовищу та кліматичній кризі. Слід зазначити, що цей підручник не є антитехнологічним – безсумнівно, цифровізація покращила життя величезної кількості людей незліченними способами. Але екологічний вплив цифрових технологій вимагає від нас глибше задуматися про те, як ми їх використовуємо та як ми можемо використовувати їх ефективніше. І гарна новина полягає в тому, що завдяки розробці програмного забезпечення розробники можуть мати негайний та значний вплив на багато питань, що обговорюються тут.
Протягом усього тексту, і особливо в наступних розділах, екомаркування «Blue Angel» для програмного забезпечення для настільних комп’ютерів слугуватиме орієнтиром для розробки програмного забезпечення для сталого розвитку. Але що взагалі означає «Blue Angel»?
Екомаркування «Blue Angel» (нім. Blauer Engel Umweltzeichen) – це офіційне екологічне маркування уряду Німеччини. У 2020 році Німецьке агентство з охорони навколишнього середовища (нім. Umweltbundesamt або UBA) опублікувало критерії нагородження для сертифікації програмних продуктів для настільних комп’ютерів, що стало першою у світі екологічною сертифікацією, яка пов’язує прозорість та автономію користувача зі сталим розвитком. Безкоштовне програмне забезпечення з відкритим кодом, або FOSS, має тут реальну перевагу. Сподіваємося, що до кінця цього підручника ви краще зрозумієте, як це зробити.
Але для того, щоб ефективно вирішити проблему, ми повинні спочатку визначити, у чому полягає проблема. Тож давайте спочатку зрозуміємо, що мають на увазі під цифровим вуглецевим слідом і як у цьому задіяне програмне забезпечення, яке ми використовуємо щодня.
Матеріальні наслідки цифрових технологій
Цифрові технології часто (і помилково) вважають несуттєвими у цьому плані. Коли ми надсилаємо електронний лист або вивантажуємо дані в хмару, легко уявити, як наші передачі зникають у небутті. Але існує цілком реальний, дуже матеріальний аспект оцифрування, який охоплює не лише наші фізичні пристрої, такі як смартфони та ноутбуки, але й переробні заводи для видобутих металів, необхідні для їхньої роботи, контейнеровози, що перевозять обладнання для масового виробництва, а також кабелі та центри обробки даних, які з'єднують їх з глобальними мережами. Звіт за 2018 рік [«Lean ICT: Towards Digital Sobriety»] (https://theshiftproject.org/wp-content/uploads/2019/03/Lean-ICT-Report_The-Shift-Project_2019.pdf) описує цю проблему так:
[М]атеріальний наслідок цифрових технологій значною мірою недооцінюється їхніми користувачами, враховуючи мініатюризацію обладнання та «невидимість» використовуваної інфраструктури. Це явище посилюється широкою доступністю послуг у «Хмарі», що робить фізичну реальність використання ще більш непомітною та призводить до недооцінки прямого впливу цифрових технологій на навколишнє середовище. (с. 10)
Як пожартував автор однієї зі статей у New York Times: «Люди думають, що дані знаходяться в хмарі, але це не так. Вони знаходяться в океані», маючи на увазі підводні комунікаційні кабелі, що охоплюють усю земну кулю. Щоб донести відчутну реальність «хмари» до землі та під океаном, нам потрібно змінити нашу перспективу на приховану інфраструктуру, яка забезпечує основу нашого цифрового життя. Мережі передачі даних можуть бути значною мірою під водою, але викиди вуглецю матимуть жахливі наслідки для всього природного середовища. На COP27 у листопаді 2022 року Генеральний секретар Організації Об'єднаних Націй Антоніу Гутерреш підкреслив критичність моменту, коли заявив: «Ми йдемо по шосе до кліматичного пекла, тримаючи ногу на педалі газу».
Цифрові технології можуть допомогти пом'якшити зміну клімату, але спочатку вони повинні перестати сприяти їй.

Що в секторі ІКТ сприяє підвищенню рівня CO2 в атмосфері?
Між 2012 і 2018 роками потреба в енергії для штучного інтелекту (ШІ) зросла в 300 000 разів, і наразі вона подвоюється кожні кілька місяців. За оцінками, навчання однієї моделі ШІ (наприклад, тої, що використовуються в машинному перекладі або моделюванні мови) може вимагати енергії, еквівалентної перельотам з Нью-Йорка до Сан-Франциско туди й назад… 300 разів (це близько 626 000 фунтів CO2)! Технологія блокчейн також є сумнозвісним фактором, що сприяє стрімкому зростанню споживання енергії, зокрема, системам підтвердження роботи, таким як Bitcoin, яка, як повідомляє Harvard Business Review, потребує стільки ж енергії, скільки цілі країни, такі як Швеція чи Малайзія.
Водночас ми використовуємо більше цифрових пристроїв, ніж будь-коли раніше. Кількість пристроїв, з'єднаних із інтернетом, зокрема ноутбуки та смартфони, а також смарт-телевізори, домашні асистенти та інші пристрої інтернету речей, стрімко зростає, і очікується, що вона перевищить 75 мільярдів до 2025 року. Це приблизно 10 пристроїв на кожну людину на землі (хоча глобальний розподіл цих пристроїв далеко не рівномірний). У світі швидко зросла популярність смартфонів, як і потреба в ресурсах, необхідних для виробництва нових та все більш потужних пристроїв. Виробництво цих пристроїв, включаючи видобуток рідкоземельних металів, необхідних для їхньої роботи, їхнього транспортування, використання та остаточна утилізація, споживають значну кількість енергії.
Однак тут важливо підкреслити, що споживання енергії — це не те саме, що викиди вуглецю. Викиди вуглецю залежать від конкретного поєднання палива, що використовується для виробництва електроенергії, яке називають [міксом виробництва електроенергії або енергії] (https://www.planete-energies.com/en/medias/close/what-power-generation-mix). Наприклад, для [енергопостачання Європейського Союзу] (https://www.bpb.de/nachschlagen/zahlen-und-fakten/europa/75140/themengrafik-energiemix-nach-staaten) у 2016 році мікс виробництва електроенергії включав 32,9% нафти, 23,9% газу, 14,9% вугілля, 13,7% ядерної енергії та 14,5% відновлюваних джерел енергії. Пісня енергетичної кризи 2022 року енергетичний баланс в ЄС змінився — у деяких випадках на кращу довгострокову перспективу, у деяких — на гіршу короткострокову перспективу. Відносні викиди вуглецю залежатимуть від цього балансу: наприклад, споживання енергії зі 100% вуглецево-нейтральних джерел не призводить до прямих викидів CO2.
Відносна шкода — Або, коли менше це не більше
Оцифрування часто асоціюється з «дематеріалізацією»: друк концертних чи туристичних квитків на папері більше не є необхідним, оскільки їх можна завантажити та подати на смартфоні; фотографії не збираються в переповнених коробках з-під взуття, а на невеликому планшеті чи жорсткому диску; тисячі фільмів і телесеріалів транслюються на ноутбуках, що робить колекції фільмів пережитком минулого. У багатьох випадках для всього вищезазначеного — і багато-багато іншого — використовується один пристрій, смартфон.
Кожен із цих матеріальних об’єктів колись був важливою частиною нашого повсякденного життя… але сьогодні вони просто більше не потрібні. Мабуть, це краще для Землі, чи не так?
Хоча цифрові пристрої можуть зменшити деякі форми відходів, оцінка справжнього впливу цифрових технологій на навколишнє середовище вимагає врахування всього життєвого циклу виробу. Це включає витрати на виробництво та транспортування цифрових пристроїв (до магазину та назад, а також на сміттєзвалище) або витрати на усунення шкоди, завданої електронними відходами, для навколишнього середовища. Це особливо актуально, якщо врахувати сукупний вуглецевий слід наших цифрових технологій, оскільки в деяких випадках виробництво пристроїв разом з їх транспортуванням та обробкою після закінчення терміну служби призводять до більших викидів парникових газів, ніж використання пристроїв протягом весь термін їхньої експлуатації. Щоб проілюструвати це, розглянемо [Звіт про екологічну відповідальність Apple] за 2019 рік (https://www.apple.com/environment/pdf/Apple_Environmental_Responsibility_Report_2019.pdf), у якому оцінюється, що Apple внесла 25,2 мільйона метричних тонн CO2 у 2018 році (с. 9). Більша частина цього — аж вісімдесят відсотків (!!!) — стосується виробництва (74%), транспортування (5%) та обробки після закінчення терміну служби (<1%). Лише 19% стосуються від фактичного використання пристроїв.
Тож коли ж витрати на виробництво цифрового пристрою, який замінить усі ці аналогові речі, стануть виправданими? Книга “Smarte Grüne Welt” (англійською: Smart Green World) авторів Стеффена Ланге та Тільмана Сантаріуса (2018) досліджує складність врахування відносної шкоди для навколишнього середовища під час спроби відповісти на такі питання. Розглянемо цей уривок, у якому автори досліджують вплив друку паперових книг на навколишнє середовище порівняно з виробництвом електронних книг (стор. 29–31; переклад з німецької):
Виробництво електронних пристроїв, очевидно, є більш енергоємним та ресурсоємним процесом, ніж друк однієї книги. Наприклад, на виробництво електронної книги, яка зазвичай вагою менше 200 грамів, витрачається близько 15 кілограмів різних матеріалів (особливо невідновлюваних металів та рідкісноземельних елементів), 300 літрів води та 170 кілограмів парникового газу вуглекислого газу. Однак вирішальними є не лише кількість вхідних та вихідних матеріалів, а й їхній вплив на навколишнє середовище. Між електронними книгами та книгами існують великі відмінності, особливо в токсичності матеріалів та виробничих процесів. Це правда, що паперова промисловість у багатьох країнах (досі) має дуже негативний вплив на навколишнє середовище, наприклад, коли хлор або кислоти отруюють місцеві води. Однак вплив електронної промисловості на навколишнє середовище іноді є руйнівним: електронні книги та інші ІТ-продукти містять бромовані антипірени, фталати, берилій та численні інші хімічні речовини, які є серйозно шкідливими для здоров'я та навколишнього середовища. Не кажучи вже про соціальні наслідки, такі як часом жалюгідні умови праці, за яких кобальт, паладій, тантал та інші ресурси цифрових пристроїв спочатку видобуваються у країнах-диктатурах, таких як Республіка Конго або в інших країнах глобального Півдня, а потім утилізуються там після закінчення терміну служби як екологічно шкідливі електронні відходи.
Незважаючи на все це, електронна книга може бути кращою за паперову книгу. Зрештою, це залежить від двох факторів: скільки книг прочитано на електронній читалці протягом її терміну служби? І скільки людей спільно використовують аналогову книгу? Щоб високі екологічні витрати на виробництво електронної книги окупилися з екологічної точки зору, на ній необхідно прочитати певну кількість книг. Це відбувається після 30-60 книг – залежно від товщини книги та залежно від екологічного показника. Якщо ви прочитаєте менше цієї кількості книг на електронній читалці, краще обрати паперову форму. Якщо ви перевищите цей показник, кожна інша книга на електронній читалці буде екологічно кращою за свою аналогову. Крім того, вирішальне значення має те, як використовуються об'єкти […]: Якщо припустити, що хтось купує книгу і не дозволяє нікому іншому її переглядати, то файл на електронній читалці приблизно в п'ять разів енергоефективніший, ніж книга. Однак ця перевага зникає, коли кілька людей спільно використовують книгу.

Отже, чи призводить заміна фізичних об'єктів цифровими технологіями до зменшення впливу на навколишнє середовище? Що ж, це залежить від обставин. Наприклад, якщо ви купите електронну книгу, чи прочитаєте ви 30–60 книг, перш ніж викинете її? Опитування Gallup показало, що у 2021 році 57% американців читали менше 5 книг на рік, а 15% читали від 6 до 10 книг. Це означає, що для понад двох третин населення США електронна книга мала б використовуватися протягом п'яти-десяти років, щоб бути більш екологічним вибором. Але скільки споживачів переходять на наступний, блискучий новий пристрій задовго до цього часу?
Варто також запитати, чи підтримуватиме компанія пристрій протягом того часу, який знадобиться, щоб він був менш шкідливим вибором. Наприкінці 2022 року список електронних книг, що зняті з виробництва у Вікіпедії містив сімдесят один пристрій. Згідно зі списком, середній термін служби, тобто від року випуску до кінця року, становив 1,5 роки — значно менше, ніж мінімальний п'ятирічний період використання, не кажучи вже про десятиліття! Скільки з цих електронних книг все ще працювали, але опинилися на сміттєзвалищі через припинення підтримки програмного забезпечення? Таке старіння обладнання є важливим фактором шкоди для навколишнього середовища, чи то у вигляді електронних відходів, чи то викидів вуглецю, пов'язаних з виробництвом пристрою. Як пишуть Ланге та Сантаріус: «є сумніви, чи всі електронні книги, що продаються, перш ніж вони зламаються або стануть технічно застарілими, використовуються в середньому настільки інтенсивно, щоб досягти загальної екологічної користі» (с. 31; переклад з німецької).
«Цунамі електронного сміття»
«Людина з електричних та електронних відходів» – це велетень заввишки сім метрів. Свою назву вона отримала від директиви 2003 року про відходи електричного та електронного обладнання (WEEE), яка встановлює цілі щодо збору, переробки та відновлення електронних відходів у ЄС,1 статуя виготовлена з 3,3 метричних тонн електровідходів, або середньої кількості електронних відходів, яку один мешканець Британії створює за життя.

E-waste is considered the “fastest-growing waste stream in the world”, with 44.7 million metric tons generated in 2016—equivalent to 4,500 Eiffel Towers, which, when stacked, is 17 times higher than Mount Everest. In 2018, an estimated 50 million metric tons of e-waste was reported, motivating the UN to refer to a “tsunami of e-waste rolling out over the world”. The numbers continue to rise: in 2021, an estimated 57 million metric tons of e-waste was generated globally. Less than 20 percent of it is collected and recycled, and although it makes up only 2% of trash in landfills, it contributes to almost 70% of the toxic waste found there.

The environmental impacts of e-waste are enormous. Electronic scrap components like CPUs contain potentially harmful materials such as lead, cadmium, beryllium, or brominated flame retardants. The end of life treatment of e-waste can also involve significant risk to the health of workers and their communities. Scavengers risk their health for the discarded precious metals in laptops and smartphones “laced with lead, mercury or other toxic substances”. The process of dismantling and disposing of e-waste has led to a number of environmental impacts in developing countries. Liquid and atmospheric emissions end up in bodies of water, groundwater, soil, and air—and therefore, also in land and sea animals, in crops eaten by both animals and humans, and in drinking water. This pollution is a crucial aspect of digital technology’s environmental harm.
Погляд на програмне забезпечення
What is the cause of all this e-waste, and why do digital devices that still work end up in landfills? Software engineering has an important but often unseen role in driving our digital consumption patterns. Manufacturers regularly encourage consumers to purchase new devices, often unnecessarily; indeed, they may even enforce it through software design. Because of licensing restrictions on software use and vendor dependencies, end users can do little about it. In short, these are largely economic—and not technological—reasons for functioning hardware becoming e-waste.

Software lock-out and programmed obsolescence result in unusable hardware. Abandonware released under a proprietary license can, at best, leave users vulnerable to viruses and other malware, and, at worst, simply stop working, without any alternative. Underlying infrastructure which people may depend on to run an application—such as software license servers used for access control by software vendors—can go offline, sometimes permanently. Users may not be able to continue using “outdated” hardware even if they wanted to.
Feature creep and other forms of software bloat may render less-powerful hardware obsolete, even though costumers never requested the extra functionalities or might wish to remove them if they could. Consider the following:
“Processing power has doubled about every two years since 1970. This means that functions are processed twice as fast and thus less energy is required for the same functions. A similar improvement in efficiency cannot be observed in the field of software. […] The availability of more and more powerful hardware has resulted in software becoming more and more bloated from version to version so that more resources are required for only minimal or even no enhancement of the functionality.” — Blue Angel Award Critera: Resource and Energy-Efficient Software Products (p. 5)
У цих випадках залежність від постачальника та обмеження для користувачів, пов'язані з розробкою та ліцензуванням програмного забезпечення, означають, що все ще функціональні пристрої викидаються на смітник, тоді як на виробництво та транспортування нових витрачається більше ресурсів.
When not rendering functioning hardware obsolete, software design which requires license servers, suffers from feature creep, etc., also results in higher energy consumption while using the software. For example, a study published by the German Environment Agency and a related article found that two applications doing the same thing and achieving the same result may have drastically different energy profiles.

Data from the study includes a comparison of two word processing programs: Word Processor 1 is identified as Open Source, while Word Processor 2 is identified as a proprietary software product. Both computer programs ran the same sequence of commands through a Standard Usage Scenario (SUS) script, corresponding to “the most representative use of the respective software over a defined period of time” (p. 23). We’ll return to usage scenario scripting in the how-to in PART III of this handbook. For now, what’s important to note is the massive difference in energy use. Running Word Processor 2 consumed 4 times the energy compared to Word Processor 1— again, and this cannot be stressed enough, to do the same task!
Якщо уважніше розглянути споживання енергії двома текстовими процесорами з часом, то також стає зрозуміло, як ці дві програми поводяться зовсім по-різному… і, можливо, всупереч очікуванням. Розглянемо графік нижче, на якому показано споживання енергії під час виконання послідовності команд сценарію використання. Приблизно на позначці 440 секунд скрипт вимагає від обох текстових процесорів збереження документа, а потім припиняє виклик подальших дій. Як бачите, текстовий процесор 1 переходить у режим очікування (як і можна було очікувати). Натомість текстовий процесор 2 продовжує працювати, споживаючи енергію, навіть після завершення скрипту.

Варто запитати, для чого потрібні додаткові дії від 440 до 600 секунд: чи необхідні дії текстового процесора 2 для функціональності програмного забезпечення? Чи збирає та передає текстовий процесор дані користувачів? Якщо так, то чи мають користувачі спосіб відмовитися від цих видів аналітики? Дійсно, автономія користувача, така як можливість вимкнення небажаного використання даних, може суттєво вплинути на енергетичний профіль програмного продукту. Інтелектуальний аналіз даних, відстеження третіх сторін, персоналізовані алгоритми максимізації залученості та реклама є значними факторами споживання енергії. Збір та аналіз даних користувачів і навчання алгоритмів на них вимагають обчислювальної потужності та інфраструктури.
Researchers in the EU have estimated the environmental costs of tracking and advertisements that users cannot opt out of, referred to as “unwanted data use” in the 2021 report “Carbon footprint of unwanted data-use by smartphones: An analysis for the EU”. The carbon footprint of this smartphone tracking—between 3 and 8 million metric tons a year in the EU alone—is “equal to the carbon footprint of between 370 and 950 thousand EU citizens” (at its worse, roughly the annual footprint of a city like Turin or Lisbon). The report points out that about 60% of European smartphone users say they would opt out of tracking and block advertisements when possible. That’s an awful lot of energy consumption for something most users don’t want in the first place!
«Вірно якраз протилежне» — парадокс Джевонса
Increases in software efficiency alone do not necessarily translate to lighter environmental footprints. For example, the “rebound effect” (also known as the “take-back effect”) describes how efficiency improvements can lead to changes in usage that decrease or even negate the original gains.
Imagine that a change in software results in a 5% improvement in energy efficiency. However, because of the increased energy savings, you might end up using the software more, leading to less energy savings overall. Let’s say that due to your increased usage, the overall energy usage of the software drops by just 1%. In this case, the rebound effect is 80% ((5-1)/5): in other words, those original efficiency gains have decreased by 80%, practically negating any savings from the improvements!
If the rebound effect goes over 100%, meaning more energy ends up being used than before, this is referred to as Jevons’ Paradox, or “back-fire”. The concept comes from the English economist William Stanley Jevons, who in 1865 recognized that technological improvements in coal-use actually increased coal consumption across industries. Jevons concluded that:
“It is a confusion of ideas to suppose that the economical use of fuel is equivalent to diminished consumption. The very contrary is the truth.” [emphasis added]
A practical interpretation of this paradox is that efficiency gains must be combined with conservation practices in order to have a meaningful effect, lest one ends up consuming more than before. The ACM report from the beginning of this section makes a similar point: “Computing-enabled efficiencies must be coupled with slashed energy demand to reduce ICT sector carbon emissions” (p. 1). In other words, both software engineering AND user behavior are crucial elements to consider when combatting the environmental harm driven by software.
Чи варте усе це зусиль?
Looking at the bigger picture, software-driven environmental harm and global greenhouse gas emissions may be less significant when compared to other industries. Therefore it seems reasonable to ask: Is it worth focusing on the environmental impacts from software, a problem that might appear relatively small in the grand scheme of things?
There are a few things we might consider here. The first is a rejection of the “Not As Bad As” fallacy, also known as “Appeal to Worse Problems”. The general argument is so: software’s contributions to global CO2 emissions may not be as bad as another industry’s, and therefore it is not worth focusing on. What’s wrong with this argument is that although another industry may be worse, this does not negate the fact that software engineering is responsible for causing serious environmental harm. What’s more, the “Not As Bad As” fallacy suggests a false choice between addressing either one problem or the other, when in fact ecologically-friendly software design is just one piece of a bigger puzzle.
Let’s not be like XKCD’s White Hat, and appeal to worse problems as an excuse not to do anything!

Second, focusing only on fixing the “biggest problem” is not necessarily the most effective strategy. It’s also important to weigh the likelihood of success when addressing an issue, as well as the time and resources required to do so. Free & Open Source Software, with its focus on user autonomy and transparency, provides unique opportunities for users, communities, and organizations to directly address intertwined social and ecological issues. FOSS can be adapted, updated, and maintained at lower cost and without vendor dependencies or artifical restrictions.
Third, it’s hopefully clear by now that software does have significant impacts on energy consumption and the production of waste, both of which have consequences for the environment. Moreover, when considered at scale minimal changes in software design can result in savings comparable to the annual energy consumption of entire cities. This claim is based on an example by SAP Product Engineer Detlef Thoms, who does back-of-the-envelope calculations (04:20–06:10) to go from a one CPU-second reduction, equivalent to about a 10 watt-second savings, to 95 thousand megawatt hour savings simply by scaling up. These savings are comparable to the annual energy consumption of over 30-thousand two-person households.


As Detlef Thoms states in the video: “Often, it is a quite manageable set of decisions which lead to significant differences in power consumption”.
Finally, in order to make claims about relative harm, it is necessary to first have estimates about actual effects. Since research in the area of software’s energy and resource consumption is still quite new, we often do not have data to make data-driven claims. With this handbook, and with the Blue Angel ecolabel as a guide, KDE hopes to help change that.
Changing our software may seem like a small gesture in addressing an issue as complex as climate change. It’s also clear that simply changing our individual consumption patterns may not be sufficient on its own (worse, evidence suggests that major contributors to global greenhouse gas emissions—such as ExxonMobile—have embraced a rhetoric of consumer individual responsibility in order to deflect from their own role in the crisis). It’s true: a zero-emissions future will require fundamental shifts in how we live, and that responsibility cannot be managed at an individual level. But consider what anthropologist Margaret Mead once observed:
“Never doubt that a small group of thoughtful, committed citizens can change the world; indeed, it’s the only thing that ever has.”
Structural change happens when dedicated, passionate people organize to confront pressing societal issues. With decades of experience successfully bringing global communities together to work toward common goals, Free & Open Source Software can be a powerful force for combatting the environmental impact of digitization. We know how to organize—now, it’s a matter of turning plans into practice, goals into reality. Let’s unite to combat software-driven environmental harm. Let’s foster a culture of digital sustainability in our software communities. Let’s build energy and resource efficient software, together!
A Note On Sources
Some material in this section is based directly on text from two Wikipedia articles: (i) “Waste Electrical and Electronic Equipment Directive” and (ii) “Electronic waste”. Both texts are released under the Creative Commons Attribution-Share-Alike License 3.0.
Частина II: Екосертифікація програмного забезпечення для робочих станцій
![]()
What do construction products, toilet paper, and software have in common?
Each of these can be eco-certified by the Blue Angel environmental label, the official environmental label of the German government!
The Blue Angel ecolabel is awarded to a range of products and services, from paper products and construction materials to printers, and it certifies that the product meets a list of stringent requirements for being environmentally friendly over a product’s life cycle. In 2020, the German Environment Agency extended the award criteria to include software products, the first environmental certification to link transparency and user autonomy with sustainability.
Specifically, the eco-certification criteria requires transparency about the software’s energy consumption when in use, while also ensuring that the software is capable of running on older hardware. Moreover, the criteria include a list of requirements related to user autonomy which can reduce the environmental impact of software.
This section provides a broad overview of the Blue Angel and the ABCs of the award criteria for desktop software. It also demonstrates how meeting the award criteria can reduce environmental harm. In particular, we will zoom in here on details about the user autonomy requirements of the Blue Angel award criteria, which we will return to in PART III. But first, a brief introduction to the Blue Angel and the KDE Eco initiative.
The Blue Angel For Desktop Software
Introduced in 1978, the Blue Angel is the first ecolabel worldwide and the official environmental label awarded by the German government. The label is adminstered by Germany’s Federal Ministry for the Environment, Nature Conservation, Nuclear Safety, and Consumer Protection (German: Bundesministerium für Umwelt, Naturschutz, nukleare Sicherheit und Verbraucherschutz, or BMUV). The Blue Angel ecolabel is also a member of the Global Ecolabelling Network (GEN), an international network of Type I ecolabels which at the time of writing has 37 members across nearly 60 countries.
![]()
The Blue Angel was not the first Type I ecolabel for software—the Hong Kong Green Council, also a member of the Global Ecolabelling Network, released criteria in 2010 for Green IT software. But the Blue Angel ecolabel criteria are the first to identify a process for measuring software’s energy consumption and to specify ways that user independence reduces environmental harm.
You may be wondering: What is a Type I environmental label? For these ecolabels, the entire life cycle of the product is taken into account. Furthermore, compliance with the award criteria is assessed by a third-party. (Compliance with Type II environmental labels, by comparison, is self-declared and do not necessitate any third-party auditing.)
The Blue Angel ecolabel has been awarded to around 100 product groups and services across a variety of sectors, including paper and construction products, furnishings, clothing, washing and cleaning agents, cleaning services, household chemicals, packaging, vehicles, energy and heating, and household electrical devices. As of 2022, with the eco-certification of KDE’s PDF and universal document reader Okular, that list also includes desktop software.
The award criteria for certification are developed transparently by the German Environment Agency. The process includes the Environmental Label Jury, a body made up of suppliers as well as civil society organizations and research institutions. The independent third-party auditor RAL gGmbH assesses compliance with the criteria and awards the seal. Importantly, the Blue Angel does not certify that a product is completely harmless. Instead, certified products represent a “lesser evil” with respect to environmental harm—this can be summed up with the motto ’as little as possible, as much as necessary’. Rather than compare different products, the Blue Angel ecolabel indicates that a product fulfills a list of requirements for a specific category.
The ABCs Of The Award Criteria
The Blue Angel’s award criteria for “Resource and Energy-Efficient Software Products” were released in January 2020. There are two primary objectives of the Blue Angel for software: (i) to award software with lower performance requirements such that “longer operating lives for […] hardware are possible”; and (ii) to recognize products which “stand out due to their high level of transparency and give users greater freedom in their use of the software” (p. 6). To achieve this, there are three main categories, referred to here as the ABCs of the award criteria: (A) Resource & Energy Efficiency, (B) Potential Hardware Operating Life, (C) User Autonomy.

The criteria in category (A) requires that the energy consumption of a software product be measured and reported, and states that the energy consumption of the application cannot increase by more than 10% from the time of its certification. Energy consumption data is measured using an external power meter and accounts for other hardware performance information, such as CPU usage or network traffic, while running the software in a representative way. We will return to this in PART III.
The criteria in category (B) ensure that the software has low-enough performance requirements to run on older, less powerful hardware at least five years old. Compliance entails a declaration of backward compatibility, with details about the hardware on which the software runs and the required software stack.
Finally, the criteria in category (C) ensure that users have an influence on the energy consumption and resource-conserving use of their software. There are eight categories for the autonomy criteria.
Data Formats — Interoperability To Give Users Choice
Data formats should not be used by vendors to lock users into using a specific computer program, nor should they impose onerous switching costs. Interoperable data formats prevent users from being stuck using a program that consumes a high amount of energy, when a more efficient program can achieve the same results with fewer hardware demands. Users should be able to easily change programs and still access all of their data.
Transparency — Removing User Dependencies For Long-Term Use
Transparency in software code and application interfaces means removing any dependencies on a particular company or organization. It also means removing restrictions on the short and long-term use of the software, and thus hardware. When developers decide to end support for their software, either security updates should continue to be provided (see below) or the source code should be made publicly available so third parties can continue providing support for the software. Furthermore, enhancing the functionality of software must not be limited by restrictive or undocumented application interfaces (APIs).
Continuity Of Support — Security Updates To Prevent E-Waste
Dependending on suppliers for essential updates should not result in abandoned software products that cannot be used without presenting serious disadvantages for the users, such as vulnerabilities to malware. Security updates should be provided for up to five years after software development is discontinued. Moreover, security updates should be separable from feature updates so that users are not coerced into adopting unwanted functionalities, e.g., feature creep and other forms of bloat. Such abandonware and software bloat leave hardware unusable and produce unnecessary e-waste.
Uninstallability — Removing Unwanted Software To Increase Efficiency
Being able to completely uninstall software that is not needed has ecological benefits. Software bloat, feature creep, and unwanted software components can create inefficiencies by occupying memory, wasting processing time, adding disk usage, consuming storage, and causing delays at system startup and shutdown. When a user no longer wishes to continue using a computer program, it must be possible to completely purge it from the system while keeping all user-generated data.
Offline Capability — To Avoid Dependencies And Decrease Energy Consumption
Use of the software should be possible without an internet connection—unless, of course, a network connection is necessary for the software’s intended functionality. License servers and other forms of access control restrict the use of an application in ways that are unnecessary to the software’s intended functionality. When a server goes down or there is Internet outage, such access control prevents people from using their software, possibly permanently. Moreover, such dependencies require network traffic and thus consume energy beyond that which is needed for the intended purpose of the software.
Modularity — To Decrease Memory And Energy Demands
Users should be able to install only what they need. Non-essential functions increase memory and energy demands, making the software less efficient and perhaps unable to run on older hardware. People should have the ability to limit the range of software functions to those that they either want or require.
Freedom From Advertising — Opting-Out To Reduce Energy Consumption
Unwanted data use in the European Union alone is roughly equivalent to the annual energy consumption of a city like Lisbon or Turin; see PART I. Allowing users to opt out of ads reduces energy and resource demands on end-user devices and on the servers running the ads. Opting out also decreases data volume transmitted and thus reduces the energy consumption for network traffic.
Documentation — To Support Resource-Conserving, Continuous Use Of Software … And Therefore Hardware
Documentation is a prerequisite for the long-term viability of a software product. Documentation must also demonstrate the software’s capacity for conserving resources. By documenting the criteria listed above, users can continue using software—and thus, hardware—in a sustainable way, while developers can maintain the software without dependencies or restrictions imposed by vendors.
Software design that complies with the award criteria is less likely to suffer from various forms of inefficiencies. This in turn can help mitigate the problem of e-waste: with software that doesn’t drive early hardware obsolescence, fewer devices need to be produced and shipped, which means fewer valuable metals that need to be mined and processed, which in turn results in a reduction of water and soil pollution. By ensuring user autonomy, developers can ensure that their software reduces environmental harm in more ways than one—whether by keeping devices in use for longer, or by reducing the software’s use of energy and resources while in use.
With its focus on transparency in resource and energy-efficiency, hardware operating life, and user autonomy, the Blue Angel award criteria for software provides a comprehensive framework to begin a discussion around software sustainability. In FOSS communities, we often take user autonomy and transparency and their benefits for granted. Although being Free & Open Source Software is not a requirement to obtain the Blue Angel ecolabel, it is in this category that FOSS really shines. In so many ways, we are already at the forefront of sustainable software design!
Okular, The First Eco-Certified Computer Program

In 2022 Okular, KDE’s popular multi-platform PDF reader and universal document viewer, was the first software product to be officially recognized for sustainable software design as reflected in the Blue Angel award criteria. Okular is also the first eco-certified computer program within the Global Ecolabelling Network.
Okular is just one software product maintained by KDE, a world-wide community of software engineers, artists, writers, translators, and creators who are committed to Free Software development. KDE maintains numerous FOSS products, including the Plasma desktop environment; the design app for painters and graphic artists, Krita; the GCompris suite of educational activities for children; Kdenlive, a professional video-editing software product; and of course Okular, a document viewer for PDFs, comics, scientific and academic papers, and technical drawings.
With KDE’s long-standing mission and guiding vision since its founding in 1996, as well as the talent and capabilities of its community members, KDE is a pioneer in championing sustainable software. In 2021 KDE started KDE Eco, a project with the goal of putting KDE and Free Software at the forefront of sustainable software design. Sustainability is not new for Free & Open Source Software (FOSS)—the four freedoms have always made Free Software sustainable software. But now, the two pillars of FOSS—transparency and user autonomy—have wider recognition for their impacts on sustainability, and were incorporated into the sustainability criteria set by the German Environment Agency through the Blue Angel ecolabel.
![]()
With the first ever eco-certified software product, the KDE community celebrated the achievement together with the wider Free Software community, as well as with the computer science department at Umwelt Campus Birkenfeld, where researchers measured the resource and energy-consumption of Okular and other KDE software.
Критерії нагородження «Блакитний ангел» точно збігаються цінностями KDE та ширшого руху FOSS. Усі ці критерії точно відповідають цінностям KDE та цінностям ширшого руху FOSS. У межах вільного програмного забезпечення із відкритим кодом гарантовано прозорість та контроль з боку користувачів, а не продавців або надавачів послуг із супроводу програмного забезпечення. Це надає змогу користувачам визначати потрібні їм параметри програмного забезпечення та, чим часто нехтують, параметри обладнання. Наприклад, користувачі можуть знизити енергоспоживання програм без втрати функціональних можливостей, встановивши лише потрібні їм компоненти, не більше і не менше; та уникнути реклами та аналізу даних, які запускають непотрібні фонові процеси, споживаючи зайві ресурси. Що стосується розробників FOSS, то вони, типово, продовжують супровід обладнання, яке промислові гіганти вважають застарілим, надаючи користувачам сучасне і безпечне програмне забезпечення для пристроїв, які за інших умов було б утилізовано як застарілі, і які б просто вирушили на смітник. Якщо коротко, наслідком свободи і прозорості для користувача, які гарантовано ліцензуванням вільного програмного забезпечення, є те, що користувач і спільноти можуть впливати на фактори, які визначають споживання ресурсів їхнім програмним забезпеченням!
Released under the GPLv2+ license, Okular is FOSS and therefore already fulfilling many of the user autonomy criteria necessary to obtain the Blue Angel seal of approval. Further work was carried out to make Okular fully compliant with the award criteria by documenting user autonomy features, providing transparency in energy and resource consumption, and supporting the potential extension of the hardware operating life of devices.

Okular lets you check digital signatures and sign documents yourself, as well as include annotated text and comments directly embedded into the document. Okular works on Linux, Windows, Android, and Plasma Mobile, and it is available to download for all GNU/Linux distributions, as a standalone package from Flathub and the Snap Store, through the KDE F-Droid release repository for Android, as well as from the Microsoft Store. The source code is also readily available at Okular’s GitLab repository for all to use, study, share, improve, and most of all, enjoy.
KDE і спільнота вільного програмного забезпечення щиро вдячні розробникам Okular за створення дружнього до середовища програмного забезпечення для усіх нас!
In PART III of this handbook, we will look at the steps you need to complete to join us in having your Free Software project also recognized for its sustainable software design. First, though, what exactly are the benefits of obtaining the Blue Angel?
Benefits Of Blue Angel
Steffi Lemke, Federal Minister for the Environment, Nature Conservation, Nuclear Safety and Consumer Protection (BMUV), has said this about the reputation of the Blue Angel:
An increasing number of people focus on durability and environmental friendliness when purchasing products. This is precisely what the Blue Angel stands for. The ecolabel has been a guarantee of high standards for the protection for our environment and health for 40 years in an independent and credible way.
Indeed, in their 40th anniversary info-booklet “Blue Angel – 40 years. Good for me. Good for the environment”, the German Environment Agency (UBA) explored the history, present, and future of the ecolabel. In the booklet, they identify some of the general criteria they consider when eco-certifying a product, such as:
- reduced emissions of harmful substances in the ground, air, water and indoors;
- sustainable production of resources;
- longevity, ability to repair and recycle the product; and
- efficient use, e.g. products which save energy.
As you reach the end of this section, we hope it is clear how compliance with the Blue Angel award criteria for desktop software promotes the above environmental benefits, among others.
Environmental labels can be an instrument to move markets in the direction of sustainable products. As the Blue Angel website states: “The aim of the environmental label is to provide private customers, large institutional consumers and public institutions with reliable guidance for environmentally conscious purchasing.”
So what does the market say?
A survey from the info-booklet found that 92% of Germans recognize the ecolabel, and for 37% the label influences their purchasing choices. The ecolabel is recognizable outside of Germany, too! Up to 15% of Blue Angel recipients are outside of Germany. One reason for this is that unlike some other ecolabels, the Blue Angel puts no requirements on where a product can be marketed. Moreover, the Blue Angel seal is considered a mark of high quality internationally, and the award criteria are viewed as an indicator of direction of the EU market—and they are even sometimes used as a guideline for optimizing products.
Receiving the Blue Angel seal can raise your product’s profile not only among individuals, but also among large organizations. Green Public Procurement (GPP) initiatives, which “seek to promote the public procurement of goods, services, and works with a reduced environmental impact throughout their life-cycle” (European Commission), influence purchasing choices both in the public and private sector. Eco-certifying your software product with the Blue Angel demonstrates a commitment to long-term digital sustainability, and it gives your product visibility both in Germany and abroad.
A Note On Sources
Some material in this section is based directly on text from two Wikipedia articles: (i) “Blue Angel (certification)” and (ii) “Software bloat”. Both texts are released under the Creative Commons Attribution-Share-Alike License 3.0. Some material in this section is also based directly on the KDE Eco blog post “First Ever Eco-Certified Computer Program: KDE’s Popular PDF Reader Okular”, which is released under the Creative Commons Attribution-ShareAlike 4.0 International License.
Частина III: Виконання критерії нагородження Blue Angel

LabPlot. (Image from Alexander Semke published under a CC-BY-NC-ND-4.0 license.)
The three main categories of the Blue Angel award criteria for desktop software are:
- (A) Resource & Energy Efficiency
- (B) Potential Hardware Operating Life
- (C) User Autonomy
In this section we’ll provide a hands-on guide to fulfilling each set of criteria. There are numerous benefits of meeting the basic award criteria. By making the energy consumption of your software transparent and complying with the hardware operating life and user autonomy criteria, you get the benefits of:
- Eco-Certification: Apply for the Blue Angel ecolabel to demonstrate to users, companies, and governmental organizations that your software is designed sustainably.
- Data-Driven Development: Locate inefficiencies in terms of energy and hardware consumption, and make data-driven decisions for your software development.
- Sustainable Design: For the long-term sustainable use of software, and thus hardware, take the user autonomy criteria into consideration when planning your software design.
- End-User Information: Highlight to your users the ways your software is already sustainably designed by using the Blue Angel criteria as a benchmark.

(A) How To Measure Your Software
The laboratory setup consists of a power meter, a computer to aggregate and evaluate the power meter output, and a desktop computer for the system under test where user behavior is emulated. The setup described here follows the specifications from the “Blue Angel Basic Award Criteria for Resource and Energy-Efficient Software Products”.
Terminology comes in part from Kern et al. (2018): “Sustainable software products — Towards assessment criteria for resource and energy efficiency”.
See also the following resources from the Umwelt Campus Birkenfeld:
- Seiwert & Zaczyk (2021): “Projektbericht: Ressourceneffiziente Softwaresysteme am Beispiel von KDE-Software” (німецькою)
- Mai (2021): “Vergleichende Analyse und Bewertung von Betriebssystemen hinsichtlich ihrer Energieeffizienz” (німецькою)
- “Підручник з OSCAR” (німецькою)
Огляд параметрів лабораторії
The laboratory setup requires 1 power meter and at least 2 computers:
Вимірювання потужності
One of the devices recommended by the Blue Angel is the Gude Expert Power Control 1202 Series (manual). It provides outlets for powering the computer and measures the current during operation. The device can be controlled and read via cabled Ethernet. There is a web-based user interface, a REST API, and the device supports various protocols such as SNMP or syslog.
Computer 1: Data Aggregator & Evaluator
The computer will be used for collecting and evaluating results from the power meter.
A Python script to read out the data from the Gude Expert Power Control 1202 Series is available at the FEEP repository.
It is recommended to monitor progress live with the second computer in order to ensure everything is proceeding smoothly. This can be done with KDE’s Labplot, for instance; read more here.
Other power meters may require non-Free software, e.g., Janitza’s GridVis Power Grid Monitoring Software.

Computer 2: System Under Test
The reference system is the hardware used to measure the energy consumption of the “system under test”, or SUT. The SUT includes the operating system and software installed for (i) testing the software product, (ii) emulating the standard usage scenario2 and (iii) collecting the hardware performance results.
Note the following:
- For GNU/Linux systems, the Blue Angel criteria (Section 1.1) require one of several Fujitsu computers as the reference system.
- For emulating activity in the standard usage scenario, Free Software task automation tools such as
xdotool,KDE Eco Tester(in progress), orActiona(GPLv3) can be used. - For collecting hardware performance data (e.g., processor and RAM utilization, hard disk activity, network traffic), the Free Software tool
Collectl(GPLv2/Artistic License) is available. - It’s also possible to repurpose cheap switchable power plugs as measurement devices; see Section “Alternative: Gosund SP111 Setup” for set up instructions.

System Under Test (SUT)
For instance, the Fujitsu Esprimo P920 Desktop-PC proGreen selection (Intel Core i5-4570 3,6GHz, 4GB RAM, 500GB HDD) is one of the recommended reference systems; see Appendix D in the award criteria for other recommended Fujitsu systems.
On the reference system you need to set up the SUT, i.e., the system on which you will test the software. The SUT must reduce unrelated energy consumption and have a standardized configuration. Recommended is the following:
- Overwrite the entire hard drive of the machine with a standardized OS.
- Deactivate all possible background processes (automatic updates, backups, indexing, etc.).
- Install the necessary software, i.e., the application to be measured as well as the user emulation (e.g.,
xdotool) and hardware performance data (e.g.,Collectl) software. - When running the usage scenario scripts, the cache should be cleared between runs and any new files deleted before starting the next measurement.
Preparing The Standard Usage Scenario (SUS)
Preparing the SUS requires the following:
- Identifying tasks users typically carry out when using the application under consideration.
- Identifying functionalities which require high energy demand or high resource utilization.
- Based on the above, scheduling a flow chart of individual actions and emulating these actions with a task automation tool.
- Scheduling a wait-period of 60 seconds before starting the measurement is recommended.
- Running the SUS for at least 5 minutes.

An automation tool is needed to run the usage scenarios so as not to require human intervention. In this way the script can be run repeatedly in a well-defined manner to provide accurate measurements.
Example tasks and functions tested in the SUS for KDE’s email client KMail include searching for an email, writing a reply or forwarding the email, saving an attachment, deleting a folder in the mail client, etc. See the Actiona scripts used to test Krita and Okular for further examples.
Important: If the emulation tool uses pixel coordinates to store the position of the automated clicks (e.g., Actiona) and, moreover, the screen resolution of the computer used in preparation differs from that of the laboratory computer, all pixel coordinates will have to be reset for the laboratory environment.
Додаткові інструменти імітації
Beyond xdotool, KDE Eco Tester (in progress), or Actiona, there are other candidates for tools which might meet the requirements. See a list from KDE Contributor David Hurka in the presentation “Visual Workflow Automation Tools”. Most of the tools use X11-specific features, and thus do not work on Wayland systems. There are a few possible approaches here:
- Selenium Webdriver using AT-SPI (currently in testing for Season of KDE 2023)
- The XDG RemoteDesktop portal
- Various Wayland protocols (support varies between compositors):
- libinput user devices
Measurement Process
The measurement process is defined in Appendix A of the Basic Award Criteria. It requires recording and logging energy data and performance indicators with a granularity of 1-second so that they can be processed and average values can be calculated.
Some general comments:
- Times between the PM and DAE must be synchronized.
- When using
Collectlto collect performance load, ensure it is running in the console of the SUT; also, check that the required CSV file is correctly generated before testing. - Since each run of the usage scenarios results in changes to the standard operating system, clearing the cache between runs is recommended.
- All runs (Baseline, Idle Mode, Standard Usage Scenario) must be for the same length of time, based on the time needed to run the usage scenario script.
- On the DAE you may want to confirm that the desired power outlet is read out correctly before and/or during testing (e.g., with a live graph using
LabPlot).
During the energy measurements, Collectl is used to record a set of performance indicators: processor utilisation, RAM utilisation, hard disk activity, and network traffic. Use the following command to obtain this hardware performance data:
$ collectl -s cdmn -i1 -P --sep 59 -f ~/<FILENAME>.csv
Параметри є такими:
-s cdmncollect CPU, Disk, memory, and network data
-i1sampling interval of 1 second
-Poutput in plot format (separated data which consists of a header with one line per sampling interval)
--sep 59semicolon separator
-f </PATH/TO/FILE>.csvsave file at specified path
Measuring Baseline, Idle Mode, And Standard Usage Scenarios
Baseline Scenario: Operating System (OS)
To establish the baseline, a scenario is measured in which the OS is running but no actions are taken.
Idle Mode Scenario: OS + Application While Idle
To establish the energy consumption and hardware performance data of the application while idle, a scenario is measured in which the application under consideration is opened but no action is taken.
Important: the baseline and idle mode must be run for the same time needed to carry out the standard usage scenario. Since the power consumption for the baseline and idle scenario is relatively uniform, 10 repetitions for each is considered sufficient to obtain a representative sample (Seiwert & Zaczyk 2021).
Standard Usage Scenario: OS + Application In Use
To measure the energy consumption and hardware performance data of the application in use, the standard usage scenario should be run; see SUS preparation notes above. The measurement of the standard usage scenario should be repeated 30 times, which will take several hours to complete. The higher number of repetitions is necessary to obtain a representative sample as the energy consumption and performance data may vary across measurements.
Monitoring Output With Labplot
You can use KDE’s LabPlot to monitor the output live as data is coming in. To do this:
- Redirect the power meter output to a CSV file.
- In LabPlot, import the CSV file by selecting
File > Add New > Live Data Source… - Under “Filter”, select the Custom option. Under “Data Format”, define the separator value used (e.g., comma, semi-colon, space).
- You can check that the output is correct under the “Preview” tab.
- If everything looks good, click OK.
- Finally, right-click on the data frame window and selecting
Plot Data > xy-Curve.
Analysis Of The Results With OSCAR
Once you have results, the Umwelt Campus Birkenfeld provides a useful tool for generating reports called OSCAR (Open source Software Consumption Analysis in R):
See also the OSCAR Manual with detailed instructions, including additional screenshots on how to use OSCAR.
Файли CSV
Analysis with OSCAR requires uploading the following files to the OSCAR website:
- (i) a log file of actions taken,
- (ii) the energy consumption data, and
- (iii) the hardware performance data.
All files should be CSV files. Some preprocessing of the raw data may be necessary (e.g., performance data measured by Collectl; see below).
Important: OSCAR is very particular about data frame formats, including column names and cell values. The tables here provide examples which are confirmed to work. If you are having issues generating a report from your CSV files, make sure CSV files are as similar as possible to those shown here.
If you just want to test OSCAR, you can download data for Okular in this ZIP file. The data are confirmed to successfully generate a report using OSCAR v0.190404. The report which was generated can also be downloaded at the FEEP repository.
Log File Of Actions
The log file of actions should have the following format. Note the columns are separated by a semi-colon. Also, columns have no names (i.e., there is no header in the CSV file). Note that the start and end of each iteration must be labelled with ‘startTestrun’ and ‘stopTestrun’ in the second column, whereas the actions can be listed with any name.
| YYYY-MM-DD HH:MM:SS ; | startTestrun ; | |
| YYYY-MM-DD HH:MM:SS ; | ; | action1 |
| YYYY-MM-DD HH:MM:SS ; | ; | action2 |
| YYYY-MM-DD HH:MM:SS ; | ; | action3 |
| YYYY-MM-DD HH:MM:SS ; | stopTestrun ; |
An example log file of actions for measuring KDE’s text and code editor Kate. The (i) date and time as well as (ii) start and stop times and (iii) actions are listed in three columns.
| 2022-05-21 18:54:36 ; | startTestrun ; | |
| 2022-05-21 18:55:41 ; | ; | go to line 100 |
| 2022-05-21 18:55:46 ; | ; | toggle comment |
| 2022-05-21 18:55:50 ; | ; | find kconfig |
| 2022-05-21 18:55:55 ; | ; | move between searches 6 times |
| 2022-05-21 18:56:05 ; | ; | close find bar |
| 2022-05-21 18:56:05 ; | ; | standby 30 sec |
| 2022-05-21 18:56:35 ; | ; | go to line 200 |
| 2022-05-21 18:56:40 ; | ; | select 10 lines |
| 2022-05-21 18:56:43 ; | ; | delete selected text |
| […] ; | ; | […] |
| 2022-05-21 18:59:13 ; | stopTestrun ; |
Дані щодо споживання енергії
The energy consumption data has the following format: the first column is the row number, the second column is the date and time in one-second increments, and the third column is the measurement output in Watts. Note that the following is confirmed to work with OSCAR: (i) the second and third column names as written below (i.e., “Zeit” and “Wert 1-avg[W]”), (ii) the date-time as a character string with the date and time separated by a comma, and (iii) no string delimiter used in the CSV file.
| ; | Zeit ; | Wert 1-avg[W] |
|---|---|---|
| 1 ; | DD.MM.YY, HH:MM:SS ; | value1 |
| 2 ; | DD.MM.YY, HH:MM:SS ; | value2 |
| 3 ; | DD.MM.YY, HH:MM:SS ; | value3 |
| 4 ; | DD.MM.YY, HH:MM:SS ; | value4 |
When using the Gude Power Meter with the Python script available at the FEEP repository, the timestamp will be recorded in nanoseconds in Epoch time. For instance, below is an example of the raw output for 7 rows from the Gude Power Meter output using the Python script. The first column shows the timestamp. The second column is the readout from the power meter in Watts.
| 1661611923019071 ; | 43 |
| 1661611923142924 ; | 43 |
| 1661611924293989 ; | 29 |
| 1661611924417017 ; | 28 |
| 1661611924744885 ; | 28 |
| 1661611924869051 ; | 28 |
| 1661611924992392 ; | 28 |
The raw data can be preprocessed in R: Nanoseconds in Epoch time can be converted to date-time with the command as.POSIXct(<NANOSECONDS>/1000000, origin = '1970-01-01', tz = 'Europe/Berlin'). For example, the nanoseconds in row 1 from the raw output is “2022-08-27 16:52:03 CEST” after conversion.
For use with OSCAR, this date-time should then be converted to a character string with the date as DD.MM.YY followed by a comma. All of this can be achieved with one command (this operation can be vectorized over the entire column in the data frame); replace the YYYY-MM-DD date with the date of your measurements:
stringr::str_replace(as.character(as.POSIXct(1661611923019071/1000000, origin = '1970-01-01', tz = 'Europe/Berlin')), '2022-08-27', '27.08.22,')
The output in Watts should be averaged per second. The same data above is shown below after processing with R; note the 7 values above are averaged per second, resulting in two rows.
To save the CSV file with a semi-colon separator, the first column with row names starting at the number 1, and no string delimiter, use the following R command:
write.csv2(<DATAFRAME>, file = <PATH/TO/FILE.csv>, row.names = TRUE, quote = FALSE)
The result should look something like the following:
| ; | Zeit ; | Wert 1-avg[W] |
|---|---|---|
| 1 ; | 27.08.22, 16:52:03 ; | 43.00000 |
| 2 ; | 27.08.22, 16:52:04 ; | 28.20000 |
Performance Data (Raw)
When using Collectl for hardware performance data, it is necessary to do the following before uploading the data to OSCAR.3
- Remove all information above the header row.
- Remove all # characters from the file.
- In the first column, no separator value should come between the data-time (otherwise, the date and time will be interpreted as two separate columns).
- The date should also have a character inserted between YYYYMMDD, e.g., MM.DD.YYYY as above. Whatever character is used must be specified in
OSCAR. - Column names can be anything you want as they will be specified within
OSCAR. - The file must be saved in CSV format.
Moreover, the hardware performance output from Collectl includes many columns that are not necessary for analysis. The only measurements that need to be specified are the following columns:
- [CPU]Totl = Processor
- [MEM]Used = Main memory - used kilobytes
- [NET]RxKBTot = Network - Kilobytes received/s
- [NET]TxKBTot = Network - Kilobytes transmitted/s
- [DSK]ReadKBTot = Disk - Kilobytes read/s
- [DSK]WriteKBTot = Disk - kilobytes written/s.
Below is an example of the preprocessed results from Collectl measuring the performance data for Kate. The timestamp increases in one-second increments.
| Date-Time ; | cpu ; | mem ; | net_rec ; | net_trn ; | dsc_rd ; | dsc_wr |
|---|---|---|---|---|---|---|
| 27.08.2022 16:47:10 ; | 1 ; | 7131968 ; | 0 ; | 0 ; | 0 ; | 0 |
| 27.08.2022 16:47:11 ; | 4 ; | 7131968 ; | 0 ; | 0 ; | 0 ; | 0 |
| 27.08.2022 16:47:12 ; | 1 ; | 7131968 ; | 0 ; | 0 ; | 0 ; | 0 |
| 27.08.2022 16:47:13 ; | 1 ; | 7131968 ; | 0 ; | 0 ; | 0 ; | 120 |
| 27.08.2022 16:47:14 ; | 1 ; | 7131968 ; | 0 ; | 0 ; | 0 ; | 0 |
| 27.08.2022 16:47:15 ; | 1 ; | 7131968 ; | 0 ; | 0 ; | 0 ; | 56 |
| 27.08.2022 16:47:16 ; | 1 ; | 7131968 ; | 0 ; | 0 ; | 0 ; | 48 |
| 27.08.2022 16:47:17 ; | 1 ; | 7131968 ; | 0 ; | 0 ; | 0 ; | 0 |
| 27.08.2022 16:47:18 ; | 1 ; | 7131968 ; | 0 ; | 0 ; | 0 ; | 0 |
| 27.08.2022 16:47:19 ; | 4 ; | 7131968 ; | 0 ; | 0 ; | 0 ; | 132 |
Uploading Data
Once the above CSV files are ready, you can run the analysis using OSCAR, which will generate a summary report you can use either for eco-certification or for your own data-driven purposes. In the OSCAR interface, note the following:
- The interface language is currently German only; see below for translations.
- The duration of the measurements in seconds must be specified.
- A semicolon separator is used.
- The correct formatting of the time stamp must be specified for each of the uploaded files, e.g.,
%Y-%m-%d %H:%M:%OS.
Step 1: Obtain Measurement Data
The landing page of the website (below) states that the first step is obtaining measurement data (German: Erfassung Messdaten). If you are at this point in the process, you should have already measured your software and prepared the CSV files.

All examples here are based on the Okular data in this ZIP file.
Step 2: Upload Measurement Data
Once you have the CSV files for the baseline, idle mode, and standard usage scenario measurements ready, click on (2) Upload Messdaten > Upload.
The measurement data (German: Messdaten) include the log file of actions (German: Aktionen), energy consumption (German: Elektrische Leistung), and hardware performance data (German: Hardware-Auslastung).
Under Messungen, upload either the idle mode or standard usage scenario measurement data.
For Art der Messung (‘Type of Measurement’) in the lower right of the UX, select Leerlauf (‘Idle Mode’) or Nutzungsszenario (‘Usage Scenario’) depending on which report you wish to generate.
Under Baselines upload the baseline measurement data.
Indicate the duration of the measurement scenarios in seconds (German: Dauer der Einzelmessungen (s)).
Note that the baseline measurements are always uploaded along with either the idle mode or standard usage scenario measurements.
See below for what a completed upload for the Nutzungsszenario looks like.

Timestamps Once the data has been uploaded, you will need to tell OSCAR how to read the data.
Let’s start with the timestamp format (German: Formatierung Zeitstempel). This is one aspect of the process which can cause problems if not done correctly. This is done under (2) Upload Messdaten > Formatierung Zeitstempel.
Consider the Okular data:
For the log file of actions, the datetime is encoded as YYYY-MM-DD HH:MM:SS (e.g., "2022-10-04 12:32:43.656" in “okularActions.csv”).
In
OSCAR, this is specified as "%Y-%m-%d %H:%M:%OS" (see screenshot below). OSCAR will take care of the fractional seconds.For the energy consumption data, the datetime is encoded as DD.MM.YY, HH:MM:SS (e.g., "04.10.22, 12:32:43" in “okular_baseline_eletrLeistung.csv”). Note the period in the date and the comma seperating date from time, as well as only having two digits for the year.
In
OSCARthis is specified as "%d.%m.%y, %H:%M:%OS" (see screenshot below), in which the lowercase “%y” indicates a year with two digits.For the hardware performance data, the datetime is encoded as DD.MM.YYYY HH:MM:SS (e.g., "04.10.2022 12:31:43" in “baseline_hardware_formatiert.csv”). Note the period in the date and the four-digit year.
In
OSCAR, this is specified as: "%d.%m.%Y %H:%M:%OS" (see screenshot below), in which the uppercase “%Y” indicates a year with four digits.

Measurement Data After the timestamps have been correctly specified, let’s explore the format of the measurement data (German: Formatierung Messdaten) in OSCAR.
First, take a look at the log file of actions (German: Aktionen). This is done under (2) Upload Messdaten > Formatierung Messdaten > Aktionen.
Here you need to indicate for the uploaded CSV file the separator (German: Trennzeichen), the string delimiter (German: Textqualifizierer), and the decimal separator (German: Dezimaltrennzeichen).
For the Okular data, this is defined as a semi-colon separator, double quotation string delimiter, and a period or full-stop decimal separator (see screenshot below).
Additionally, you will need to specify the following:
- whether the first line contains headings (German: Erste Zeile enthält Überschriften);
- the number of lines to skip (German: Anzahl zu überspringender Zeilen); and
- the character encoding (German: Zeichensatz (Encoding)).
For the Okular data, this is defined as follows in the following screenshot: “first line contains headings” is unchecked, 0 lines are skipped, and character encoding is utf-8.
When everything is defined correctly, a preview of the spreadsheet will be shown.

Second, take a look at the energy consumption measurements (German: Elektrische Leistung). This is done under (2) Upload Messdaten > Formatierung Messdaten > Elektrische Leistung.
The required input is the same as for the log file of actions, seen in the following screenshot.
For the Okular data here, this is a semi-colon separator, double quotation string delimiter, and character encoding utf-8. However, now a comma is specified for the decimal separator and a checkmark indicates that the first line contains headings. Finally, the 1st line is skipped.
When everything is defined correctly, a preview of the spreadsheet will be shown.

Finally, take a look at the hardware performance data (German: Hardware-Auslastung). This is done under (2) Upload Messdaten > Formatierung Messdaten > Hardware-Auslastung.
The required input is the same. The input in this example is a semi-colon separator, a double quotation string delimiter, a period (a.k.a. full stop) decimal separator. There is a checkmark that the first line contains headings, 0 lines are skipped, and the character encoding is utf-8.
However, now there is the additional requirement of specifying the columns (German: Spalten).
For the columns specification, the following need to be identified; select NA for unused columns, e.g., “Auslastung Auslagerungsdatei” here.
- Zeitstempel: Datetime (i.e., ‘Date-Time’)
- CPU-Auslastung: CPU (i.e., ‘X.CPU.Totl’)
- RAM-Auslastung: RAM (i.e., ‘X.MEM.Used’)
- Über Netzwerk gesendet: Network transmitted (i.e., ‘X.NET.TxKBTot’)
- Über Netzwerk empfangen: Network received (i.e., ‘X.NET.RxKBTot’)
- Von Festplatte gelesen: Disk read (i.e., ‘X.DSK.ReadKBTot’)
- Auf Festplatte geschrieben: Disk written (i.e., ‘X.DSK.WriteKBTot’)
- Auslastung Auslagerungsdatei: Swap (here, ‘N/A’)

Переклади
Here is an overview of some of the German terminology used in OSCAR and the English translations:
- Messungen: Measurements (e.g., Idle Mode or SUS)
- Aktionen: Actions (i.e., log file of actions taken)
- Elektrische Leistung: ‘Electrical power’ (i.e., energy consumption measurements)
- Hardware-Auslastung: ‘Hardware load’ (i.e., hardware performance measurements)
- Dauer der Einzelmessungen (s): ‘Duration of the individual measurements (s)’ (i.e., specify how long each iteration was in seconds)
- Art der Messung: ‘Type of measurement’
- Leerlauf: ‘Idle’ (i.e., Idle mode)
- Nutzungsszenario: ‘Usage scenario’ (i.e., SUS)
- Formatierung Messdaten: ‘Formatting measurement data’
- Formatierung Zeitstempel: ‘Formatting timestamp’
- Trennzeichen ‘Separator’
- Textqualifizierer: ‘String delimiter’
- Dezimaltrennzeichen: ‘Decimal separator’
- Erste Zeile enthält Überschriften: ‘First line contains headings’
- Anzahl zu überspringender Zeilen: ‘Number of lines to skip’
- Zeichensatz (Encoding): ‘Character set (encoding)’
- Spalten: Columns
- Zeitstempel: ‘Datetime’
- CPU-Auslastung: ‘CPU utilization’
- RAM-Auslastung: ‘RAM utilization’
- Über Netzwerk gesendet: ‘Sent via network’
- Über Netzwerk empfangen: ‘Received via network’
- Von Festplatte gelesen: ‘Read from disk’
- Auf Festplatte geschrieben: ‘Written to disk’
- Auslastung Auslagerungsdatei: ‘Swap file utlization’
Step 3: Generating The Reports (Idle, SUS)
After completing the above, the report can be generated and downloaded. You will need to do this process twice, once for (i) the idle mode and (ii) standard usage scenario measurements, resulting in two documents.

For Blue Angel eco-certification, the two reports will be submitted for evaluation by RAL.
For examples of the above for Okular, see KDE’s Blue Angel Applications repository:
Preparing The Documentation For Blue Angel
For Blue Angel eco-certification, it is necessary to complete several forms alongside the two reports from OSCAR.
Information that needs to be included in the forms is as follows:
- Details about the software (name, version) and measurement process (when and where measurements were made, etc.).
- Technical details about the power meter (instrument, sampling frequency, length of scenario, sample size).
- Technical details about the reference system (year, model, processor, cores, etc.).
- Software stack used for the measurements (
xdotool,Collectl, etc.). - Minimum system requirements (processor architecture, local working memory, etc.).
- Energy consumption results found in the
OSCARreports or equivalent. - Hardware utilization results, which includes the following (for IDLE use the idle mode measurements, and for SUS use the standard usage scenario measurements):
Full Load: “For processing power, the full load is 100%, for working memory the sum of the installed RAM capacities, for network bandwidth the maximum transmission speed, etc.” (Blue Angel award criteria: p. 23).
Base Load: Average load for the reference system in Baseline measurements.
Idle/SUS Load: Average load for the reference system for IDLE/SUS measurements.
From the above measurements, the following calculations are made for hardware utilization (for IDLE use the idle mode measurements, and for SUS use the standard usage scenario measurements):
- Net Load: IDLE/SUS Load - Base Load
- Allocation Factor: Net Load/(Full Load - Base Load)
- Effective Load: Net Load + Allocation Factor * Base Load
- Hardware Utilization (SUS only): Effective Load * Time (seconds)
For Blue Angel eco-certification, the above information will be added to two documents called “Annex 1” and “Annex 2”.
For examples of the above for Okular, see KDE’s Blue Angel Applications repository:
Alternative: Gosund SP111 Setup
Want to get started with the process of measuring your software, but short on cash or gear? Want to give the process a try without setting up a dedicated lab? Try this hack converting an inexpensive power plug to a power meter, courtesy of Volker Krause, who also documented the process provided here. You can read more at the following posts from Volker’s blog:
Below is a guide to setting up a Gosund SP111 power plug already flashed with Tasmota firmware in 10 steps.
Although the data from the inexpensive power meter will likely not be accepted by the Blue Angel for eco-certification, it is nonetheless possible to obtain preliminary data using this tool.
(0) Prerequisite
It is necessary to have the power plug already flashed with a sufficiently new Tasmota version.
(1) Firmware Reset
If the device had previously been connected to another Wifi network, it might need a full reset before being able to connect to a new one.
If the device did open a WiFi access point named “tasmota-XXXXX” this is not needed, continue directly to (2).
Press the button for 40 seconds.
The device will restart and you should be able to continue at (2).
(2) WiFi Setup
The device opens a WiFi access point named “tasmota-XXXXX”—connect to that.
Open http://192.168.4.1 in a browser.
The device will ask you for the WiFi name and password to connect to after entering those. The device will reconnect to that WiFi and disable its access point.
While doing that it should show you its new address in the browser—make a note of it.
In case that did not happen, check your WiFi router for the address of the device.
(3) Tasmota Setup
Open the address from step (2) in a browser.
You should see the Tasmota web UI (a big “ON/OFF” text and a bunch of blue and one red button).
Click “Configuration”.
Click “Configure Other”.
Copy
     {"NAME":"Gosund SP111 2","GPIO":
     [56,0,57,0,132,134,0,0,131,17,0,21,0],"FLAG":0,
     "BASE":18}
into the template input field.
Tick the “Activate” checkbox.
Натисніть «Зберегти».
The device will restart; connect to it again.
The UI should now also contain text fields showing electrical properties, and the “Toggle” button should now actually work.
(4) Калібрування
Open the address from step (2) in a browser.
Connect a purely resistive load with a known wattage, such as a conventional light bulb (not a LED or energy-saving bulb).
Switch on power by clicking “Toggle” if needed.
Verify that the “Power Factor” value is shown as 1 (or very close to 1); if it is lower, the current load is not suited for calibration.
Click “Console”.
Enter the following commands one at a time and press enter:
   AmpRes 3
   VoltRes 3
   EnergyRes 3
   WattRes 3
   FreqRes 3
   SetOption21 1
   VoltageSet 230
Enter the command PowerSet XXX with XXX replaced by the wattage specified for the test load (e.g., “40” for a 40W light bulb).
Click “Main Menu”.
The main page now should show correct power readings with several decimals precision.
(5) MQTT Broker Setup
At present, the only known way to achieve high-frequency automatic readouts is by polling over MQTT. This is not ideal and needs additional setup, unfortunately.
If you happen to have a MQTT Broker around already, skip to step (6); otherwise, you need to set one up. The below scenario assumes Mosquitto is packaged for your GNU/Linux distribution (and therefore does not configure any security), so only do this in your own trusted network and switch it off when not needed.
install the
mosquittopackageadd a file
/etc/mosquitto/conf.d/listen.confwith the following content:listener 1883 allow_anonymous truestart Mosquitto using
systemctl start mosquitto.service
(6) MQTT Tasmota Setup
Connect to the Tasmota device using a web browser, and open the MQTT configuration page via Configuration > Configure MQTT.
Enter the IP address of the MQTT broker into the “Host” field.
Note down the value shown right of the “Topic” label in parentheses (typically something like “tasmota_xxxxxx”). This will be needed later on to address the device via MQTT. You can also change the default value to something easier to remember, but this has to be unique if you have multiple devices.
Натисніть «Зберегти».
The device will restart and once it is back you should see output in its Console prefixed with “MQT”.
(7) Verifying MQTT Communication
This assumes you have the Mosquitto client tools installed, which are usually available as distribution packages.
You need two terminals to verify that MQTT communication works as intended.
- In terminal 1, run
mosquitto_sub -t 'stat/<topic>/STATUS10' - In terminal 2, run
mosquitto_pub -t 'cmnd/<topic>/STATUS' -m '10'
Replace
<topic>with the value noted down in step (6).Everytime you run the second command, you should see a set of values printed in the first terminal.
- In terminal 1, run
(8) Continuous Power Measurements
See these scripts.
(9) Switching WiFi Networks
For security reasons, once connected to a WiFi network, Tasmota will not let you get back to step (2) by default without hard resetting the device (40-second button press). However, a hard reset also removes all settings and the calibration. If you need to move to a different network, there are less drastic options available, but these changes can only be made inside the network you originally connected to:
Under Configuration > Configure WiFi, you can add details for a second WiFi access point. Those will be tried alternatingly with the first configuration by default. This does not compromise security, but requires you to know the details for the network you want to connect to.
You can configure Tasmota to open an access point as in step (2) by default for a minute or so after boot, and then try to connect to the known configurations. This makes booting slower in known networks, and opens the potential for hijacking the device, but it can be convenient when switching to unknown networks. This mode can be enabled in the Console by the command
WifiConfig 2, and disabled by the commandWifiConfig 4.For Tasmota version 11 the 40-second button press reset can leave the device in a non-booting state, whereas resetting from the Console using
Reset 1doesn’t have that problem, but has to be done before disconnecting from the known WiFi as well.(10) Recovering Non-Booting Devices
First and foremost: DO NOT CONNECT THE DEVICE TO MAIN POWER! That would be life-threatening. The entire flashing process is solely powered from 3.3V supplied by the serial adapter. Do not do any of this without having read this getting started guide.
With Tasmota 11, you can end up in a non-booting state by merely resetting the device using the 40-second button press. This does not permanently damage the device, and it can be fixed with reflashing via a serial adapter.
The basic process is described in the above guide. The PCB layout of the Gosund SP 111 can be seen here.
In order for this to work, you need to connect GPIO0 (second pin on bottom left in the above image) to GND before powering up (i.e., before connecting with USB). The device LEDs (red and blue) are a useful indicator of whether you ended up in the right boot mode: the red LED should be on, and not flashing quickly, and the blue and red LED should not be on together. Once in that state, the connection can be removed (e.g., if you just hold a jumper cable to the pin) and it will remain in the right mode until a reboot.
Again: DO NOT CONNECT THE DEVICE TO MAIN POWER as this is life-threatening.
(Б) Експлуатаційний ресурс обладнання
The criteria in category (B) ensure that the software has low-enough performance requirements to run on older, less powerful hardware at least five years old.
Many FOSS applications run on hardware much older than 5 years. In fact, members of the KDE community have noted that KDE’s desktop environment Plasma runs on hardware from even 2005!
This category is relatively easily to fulfill for the Blue Angel application. Compliance entails a declaration of backward compatibility, including details about the hardware on which the software runs and the required software stack. To demonstrate compliance, document the following information in two documents called “Annex 1” and “Annex 2”:
- Reference System Year — e.g., 2015
- Model — e.g., Fujitsu Esprimo 920
- Processor — e.g., Intel Core i5-4570
- Cores — e.g., 4
- Clock Speed — e.g., 3,6 GHz
- RAM — e.g., 4 GB
- Hard Disk (SSD/HDD) — e.g., 500 GB
- Graphics Card — e.g., Intel Ivybridge Desktop
- Network — e.g., Realtek Ethernet
- Cache — e.g., 6144 KB
- Mainboard — e.g., Fujitsu D3171-A1
- Operating System — e.g., Ubuntu 18.04
Again, examples for Okular can be found at the following links:
(C) User Autonomy
As discussed in PART II, the Blue Angel user autonomy criteria cover eight general areas:
- Формати даних
- Прозорість
- Неперервна підтримка
- Неможливість вилучення
- Offline Capability
- Modularity
- Freedom From Advertising
- Документація
Many FOSS projects may take for granted that Free Software respects user autonomy and in some cases information from the above list is missing from websites, manuals, wikis, etc. This may include documentation about support for open standards, uninstallability, continuity of support, and so on.
Documenting this information is important, both for fulfilling the Blue Angel award criteria and for giving users information about long-term sustainable use of their software and hardware.
This is not an exhaustive presentation for each of the above categories of the Blue Angel criteria. Rather, this guide focuses on aspects of the criteria which KDE/FOSS projects can easily document and provide (which is already most of the work). For the full criteria, see Section 3.1.3 in the basic award criteria.
2.1 Формати даних
The main information to include in documentation:
- Which (open) data formats are supported—with links to specifications, e.g., PDF?
- Also of interest: Are there examples of other software products that process these data formats?
For an example of the online documentation of supported data formats for Okular, visit the Okular website.
An example of documentation for the Blue Angel can be found in Annex 4.
2.2 Transparency Of The Software Product
When missing, provide links to documentation of the API, source code, and software license. For example, for KMail:
An example of documentation for the Blue Angel can be found in Annex 5.
2.3 Неперервна підтримка
Details about continuity of support to document include:
- Information about how long the software has been supported for (with links to release announcements).
- Release schedule and details (e.g., who maintains the software).
- Statement that updates are free of charge.
- Declaration on how the free and open source software license enables continuous support indefinitely.
- Information about whether and how functional and security updates may be installed separately.
An example of Okular’s continuity of support documentation for the Blue Angel can be found in Section 3.1.3.3 of Annex 6.
2.4 Неможливість вилучення
How are users able to completely uninstall the software? Relevant details might include:
- Uninstallation instructions that depend on how the software was installed (source code or binary).
- Examples of uninstallation instructions (source code or package managers, with relevant links to documentation).
- Information about whether user-generated data is also removed when uninstalling a program.
An example of Okular’s uninstallability documentation for the Blue Angel can be found in Section 3.1.3.4 of Annex 6.
2.5 Offline Capability
Does the software require external connections such as a license server in order to run? If not, and no network connection is needed as the software can be used offline, this should be documented.
An example of Okular’s offline capability documentation for the Blue Angel can be found in Section 3.1.3.5 of Annex 6.
2.6 Modularity
Information to document includes:
- What aspects of the software are modular and can be deactivated during installation?
- Can the software manuals or translations be installed separately?
- Are any modules which are unrelated to the core functionality included with installation, such as tracking modules or cloud integration? If not, document it!
An example of Okular’s modularity documentation for the Blue Angel can be found in Section 3.1.3.6 of Annex 6.
2.7 Freedom From Advertising
If the software does not display advertising, make this explicit in manuals and wikis and declare it in the Blue Angel application document.
2.8 Документація
This includes the following:
- General process for installing/uninstalling the software? This may include generic instructions or tutorials for a specific desktop environment or package manager.
- Data import/export process?
- What can users do to reduce the use of resources (e.g., configuration options for improving performance)?
- Does the software have any resource-intensive functionality not necessary for the core functionality? If not, great. Let’s tell the users!
- Licensing terms related to further development of the software products, with links to source code and license?
- Who supports the development of the software?
- Does the software collect any personal data? Is is compliant with existing data protection laws? If yes, document it!
- What is the privacy policy? Is there telemetry? If yes, how does the software handle data security, data collection, and data transmission? Also, are there ads or tracking embedded in the software? If not, excellent—now make sure to spread the word!
An example of Okular’s product documentation for Blue Angel certification can be found in Section 3.1.3.8 of Annex 6.
Submitting To RAL
For examples of all of the above documentation, see KDE’s Blue Angel Applications repository.
Once you have all of the documentation prepared, you need to submit it for review to RAL gGmbH (if you recall, RAL is the authorized body that assesses compliance with the award criteria). The portal for submitting Blue Angel applications can be found here (https://portal.ral-umwelt.de/).
If you need help with the online interface, RAL provides documentation.
Example Submission Documents
Below are examples of Blue Angel documentation for Okular.
- Annex 1: Form
- Annex 2: Spreadsheet
- Annex 3: OSCAR Report For Idle Mode
- Annex 3: OSCAR Report For SUS
- Annex 4: Data Formats
- Annex 5: Open Standards
- Annex 6: Product Information
- Annex 7: Data format for passing on the product information about resource and energy efficiency
Notable Sustainable Software Initiatives
There are many initiatives working on tooling for measuring the energy consumption of software. We would like to mention five in particular who have been collaborating with the KDE Eco initiative:
The Green Software Engineering work group at the Environmental Campus Birkenfeld (German: Umwelt Campus Birkenfeld)
Since 2008, the Green Software Engineering work group have been working on research projects with a focus on sustainable software. Their research provides the foundation of the work here, and their team developed tools such as
OSCARand have measured various KDE applications, including Okular.The Öko-Institut is one of Europe’s leading independent research and consultancy organizations working for a sustainable future. The Sustainable Products & Material Flows research group is working on various measurement methodologies. In this blog post (in German) researchers present a self-measurement technique using a simple Python script.
Green Coding Berlin is focused on research into the energy consumption of software and its infrastructure, creating open source measurement tools, and building a community and ecosystem around green software.
The SoftAWERE project from the Sustainable Digital Infrastructure Alliance
The SoftAWERE steering group oversees and sets the direction for the development of tools and labels for energy-efficient software applications.
The Green Web Foundation tracks and accelerates the transition to a fossil-free internet.
Про нас
Автори
KDE Eco tooling and documentation are provided by community members who have volunteered to contribute to this project for the benefit of all. Primary contributors include (listed in alphabetical order by first name): Arne Tarara, Cornelius Schumacher, Emmanuel Charruau, Karanjot Singh, Nicolas Fella, and Volker Krause. Thank you—your contributions make this handbook possible.
The text of this version of the handbook was written and/or compiled from the above documentation by Joseph P. De Veaugh-Geiss. Olea Morris edited the text. Lana Lutz and Arwin Neil Baichoo made the book and website design as well as the images therein beautiful. Paul Brown made significant improvements to the Okular blog post adapted for “Okular, The First Eco-Certified Computer Program” in Part II. Wikipedia was a source for several texts which were included here in modified form. Thank you to the community of Wikipedia writers and editors for making such a wonderful resource for all of us. See the end of each section for additional information about sources.
Подяки
Thank you to the many contributors to the KDE Eco initiative in general (listed in alphabetical order by first name): Achim Guldner, Adriaan de Groot, Aleix Pol, Alexander Semke, André Pönitz, Björn Balazs, Carl Schwan, Chris Adams, Christopher Stumpf, David Hurka, Fabian, Felix Behrens, Franziska Mai, Harald Sitter, Jens Gröger, Johnny Jazeix, Jonathan Esk-Riddell, Kira Obergöker, Lydia Pintscher, Marina Köhn, Mathias Bornschein, Max Schulze, Phu Nguyen, Sami Shalayel, Stefan Naumann, Sven Köhler, and Tobias Fella. Your contributions are greatly appreciated.
People who are interested in contributing to KDE Eco are encouraged to join the mailing list or Matrix room. Contributors are also invited to join one of the KDE Eco sprints and in-person or online meetups. Learn more at out website.
The KDE Eco initiative has benefitted from many informative discussions that took place at the following conferences and workshops: Akademy 2022, Linux App Summit 2022, FOSDEM 2023, rC3: NOWHERE 2021, SFSCon 2021/2022, Grazer Linuxtage 2022, Qt World Summit 2022, QtDevCon 2022, Fedora Nest 2022, Green Coding Berlin meetups, Sustainable Digital Infrastructure Alliance hackathon, EnviroInfo 2022, and Bits & Bäume 2022. Thank you!
Ліцензування
Unless indicated otherwise, all contents released under the Creative Commons Attribution-ShareAlike 4.0 International (CC-BY-SA-4.0) license. For more information about documentation licensing at KDE, see KDE’s licensing policy.
Зауваження щодо фінансування
Проєкт Blauer Engel Für FOSS було профінансовано Федеральною Агенцією з навколишнього середовища Німеччини (UBA) та Федеральним міністерством навколишнього середовища, збереження природи, ядерної безпеки та захисту споживачів (BMUV). Доступ до фінансування було затверджено Бундестагом ФРН.


За вміст цієї публікації відповідає її видавець.
У 2005 році, через два роки після того, як директиву було реалізовано у європейському законодавстві, Королівське товариство мистецтв у Великій Британії представило «Людину WEEE», розроблену Полом Бономіні та виготовлену компанією Stage One Creative Services. Спочатку її було розміщено на південному березі Лондона, згодом цю величну фігуру було перенесено до проєкту Eden у Корнуоллі, де вона й зараз знаходиться. ↩︎
It is possible to have a setup using 3 computers, with the Standard Usage Scenario emulation generated on a computer independent of the SUT; see Kern et al. (2018). Details of such a setup with an external workload generator can be found at the FEEP repository. ↩︎
See Seiwert & Zaczyk 2021: p. 13 for details; see also Appendix A 2 on p. 46 for a Python script to automate some of these tasks. ↩︎