Aplicación de los criterios de Blue Angel al software libre
Un manual para la certificación de software como sostenible (febrero de 2023)
Introducción: ¿De qué se trata todo esto?
Este manual proporciona una visión general del daño ambiental provocado por el software y de cómo la etiqueta ecológica Blue Angel (la etiqueta ambiental oficial del gobierno alemán) ofrece una referencia para el diseño de software sostenible.
El premio Blue Angel se otorga a una amplia gama de productos y servicios, desde productos de limpieza para el hogar hasta pequeños electrodomésticos y materiales de construcción. En 2020, la Agencia Federal de Medio Ambiente de Alemania amplió los criterios de elegibilidad para incluir productos de software. Fue la primera certificación ambiental del mundo en vincular la transparencia y la autonomía del usuario —dos pilares del software libre y de código abierto (FOSS)— con la sostenibilidad.
Llegados a este punto, quizá te preguntes: ¿Qué tiene que ver la sostenibilidad con el software? ¿Cómo puede algo aparentemente tan inmaterial como el software tener un impacto medioambiental? En este manual analizaremos con más detalle algunas de las formas en que el software contribuye a la crisis climática y cómo el cumplimiento de los criterios del galardón Blue Angel para la certificación ecológica del software puede ser de ayuda.
El libro está dividido en tres partes:
- Parte I: Impacto ambiental del software
- Parte II: Software de escritorio ecocertificado
- Parte III: Cumplimiento de los criterios del galardón Blue Angel
Mientras que la Parte I explora el por qué y la Parte II el qué de la ecocertificación de software, la Parte III aborda el cómo explicando lo que se necesita saber para medir el consumo energético del software y solicitar la etiqueta ecológica «Blue Angel». En concreto, en esta sección proporcionamos una guía paso a paso para cumplir con los criterios básicos de la certificación: (A) Eficiencia energética y de recursos, (B) Vida útil potencial del hardware y (C) Autonomía del usuario.
Parte I: Impacto ambiental del software

En 2021, la Association for Computing Machinery (ACM), la sociedad científica y educativa de informática más antigua del mundo, publicó un informe del Technology Policy Council con el título «Informática y cambio climático». Entre otros hallazgos, el informe analiza el aumento exponencial del consumo de energía y recursos de la inteligencia artificial y los dispositivos conectados a internet, tanto en su producción como en su uso. Las estimaciones del informe son asombrosas. Solo en 2021, se estima que el sector de las Tecnologías de la Información y la Comunicación (TIC) generó entre el 1,8 % y el 3,9 % de las emisiones globales de carbono. Para ponerlo en perspectiva, esto es equivalente al impacto de la industria de aviación mundial, que se estima que genera el 2,5 % de todas las emisiones. El informe advierte que, si no se toman medidas, para 2050 las emisiones de carbono atribuibles al sector de las TIC superarán el 30 % de las emisiones globales.

En sus conclusiones, los autores reconocen una contradicción inherente a la digitalización: la tecnología digital «puede ayudar a mitigar el cambio climático», pero «primero debe dejar de contribuir a él» (p. 1). Las TIC han revolucionado nuestra forma de vida y a menudo se las elogia por aportar comodidad y eficiencia a nuestra vida diaria. Las empresas han aprovechado la tecnología digital para la distribución eficiente de todo tipo de bienes de consumo y la desmaterialización de productos cotidianos. Vehículos como coches, patinetes y bicicletas están fácilmente disponibles para alquilar a través de aplicaciones para teléfonos inteligentes, eliminando la necesidad de que las personas los posean para usarlos. La amplia disponibilidad de la transmisión de vídeo en streaming significa que no es necesario producir ni transportar DVD y discos Blu-ray para ver una película, y quemar combustible para conducir hasta la tienda de alquiler para escoger uno un sábado por la noche es cosa del pasado. Los lectores electrónicos han sustituido a estanterías enteras. Con la pandemia mundial del SARS-CoV-2 acelerando la integración de la digitalización en todos los aspectos de la vida diaria, las videoconferencias están sustituyendo eventos que antes se celebraban (casi) exclusivamente en persona, incluidas reuniones de oficina, conferencias académicas internacionales, recitales de piano locales e incluso primeras citas… todo ello posible ahora desde la comodidad del propio hogar con un dispositivo conectado a internet.
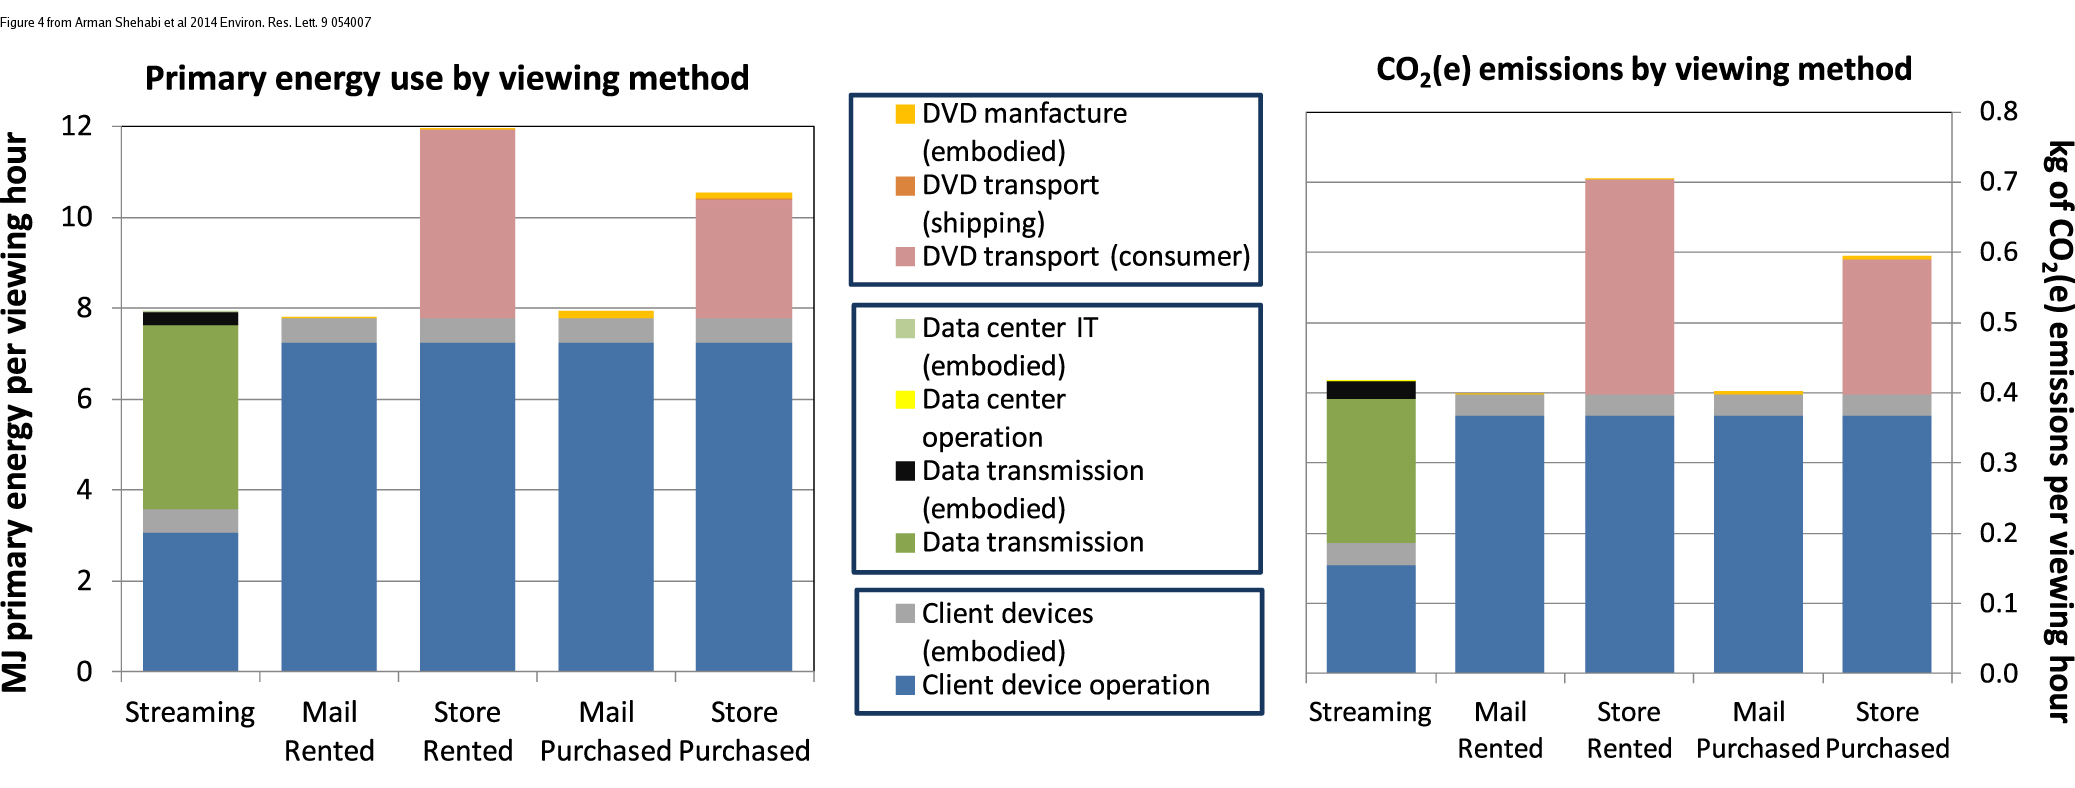
A pesar de todas las maneras en que los avances tecnológicos aparentemente han hecho nuestras vidas menos materiales y menos derrochadoras, y por lo tanto más cómodas y eficientes, puede parecer que el rápido ritmo de la digitalización hace más bien que mal en lo que respecta al logro de los objetivos de sostenibilidad.
¿Pero es realmente así?
Internet y los dispositivos que usamos para conectarnos a él requieren infraestructura: hardware físico que consume energía y recursos. A menudo se pasan por alto los impactos ambientales de, por ejemplo, las fábricas que producen estos dispositivos o la infraestructura que abarca continentes y que permite la comunicación global. Todo esto requiere energía para su uso diario. Además, el hardware que ya no se usa termina en centros de eliminación para su tratamiento al final de su vida útil (lo que requiere aún más energía) o como residuos electrónicos tóxicos para las personas y el medio ambiente. Posteriormente, se producen y transportan nuevos dispositivos, en muchos casos innecesariamente.
«Un hecho que rara vez se valora es que la clave para aumentar la eficiencia energética y proteger los recursos naturales no reside en el hardware, sino sobre todo en el software» (criterios del galardón Blue Angel: Productos de software eficientes en recursos y energía). (p. 5)
En este contexto más amplio, el papel fundamental que desempeña el software en la contribución al daño ambiental puede pasarse por alto. De hecho, en muchos casos es el software el que determina el consumo de energía y la vida útil de la infraestructura digital. Este manual examinará con mayor detalle algunas de las formas en que la tecnología digital contribuye al daño ambiental y a la crisis climática. Cabe aclarar que este manual no es contrario a la tecnología: sin duda, la digitalización ha mejorado la vida de muchísimas personas. Sin embargo, los impactos ecológicos de la tecnología digital nos obligan a reflexionar más profundamente sobre cómo la utilizamos y cómo podríamos usarla de manera más eficiente. La buena noticia es que, a través del diseño del software, los desarrolladores pueden tener una influencia inmediata y significativa en muchos de los temas que aquí se abordan.
A lo largo del texto, y especialmente en las secciones posteriores, la etiqueta ecológica Blue Angel para software de escritorio servirá como referencia para el diseño de software sostenible. Pero, ¿qué significa exactamente «Blue Angel»?
La ecoetiqueta Blue Angel (en alemán, Blauer Engel Umweltzeichen) es el sello ambiental oficial del gobierno alemán. En 2020, la Agencia Federal de Medio Ambiente de Alemania (en alemán, Umweltbundesamt, o UBA) publicó los criterios de certificación para software de escritorio, la primera certificación ambiental del mundo que vincula la transparencia y la autonomía del usuario con la sostenibilidad. El software libre y de código abierto (FOSS) tiene una clara ventaja en este sentido. Esperamos que al final de este manual comprendas mejor cómo.
Pero, para abordar un problema de manera efectiva, primero debemos identificar cuál es el problema. Así que, en primer lugar, comprendamos qué se entiende por huella de carbono digital y cómo influye en ella el software que usamos a diario.
Huella material de la tecnología digital
La tecnología digital se asocia a menudo (erróneamente) con lo inmaterial. Cuando enviamos un correo electrónico o subimos datos a la nube, es fácil imaginar que nuestras transmisiones desaparecen en el éter. Pero la digitalización tiene un aspecto muy real y material, que abarca no solo nuestros dispositivos físicos, como teléfonos inteligentes y portátiles, sino también las plantas de procesamiento de metales necesarios para su funcionamiento, los buques portacontenedores que transportan el hardware producido en masa y los cables y centros de datos que los conectan a las redes globales. El informe de 2018 «Lean ICT: Towards Digital Sobriety» describe la cuestión de la siguiente manera:
La huella material de la tecnología digital suele ser subestimada por sus usuarios, dada la miniaturización de los equipos y la «invisibilidad» de las infraestructuras utilizadas. Este fenómeno se ve reforzado por la amplia disponibilidad de servicios en la «nube», lo que hace que la realidad física de su uso sea aún más imperceptible y conlleva a subestimar el impacto ambiental directo de la tecnología digital. (p. 10)
Como se decía en broma en un artículo del New York Times, «la gente cree que los datos están en la nube, pero no es así. Están en el océano», refiriéndose a los cables de comunicación submarinos que recorren el planeta. Para traer la realidad tangible de la «nube» al suelo y bajo el océano, necesitamos cambiar nuestra perspectiva hacia la infraestructura oculta que proporciona la base de nuestras vidas digitales. Las redes de datos pueden estar en gran parte bajo el agua, pero las emisiones de carbono tendrán consecuencias nefastas para todos los entornos naturales. En la COP27, en noviembre de 2022, el Secretario General de las Naciones Unidas, António Guterres, subrayó la urgencia del momento al afirmar: «Vamos directos al infierno climático con el pie en el acelerador».
La tecnología digital puede ayudar a mitigar el cambio climático, pero primero debe dejar de contribuir a él.

Dentro del sector de las TIC, ¿qué factores contribuyen al aumento atmosférico de CO2?
Entre 2012 y 2018, la demanda de energía de la inteligencia artificial (IA) aumentó 300 000 veces, y actualmente se duplica cada pocos meses. Se ha estimado que entrenar un solo modelo de IA (como los que se utilizan en la traducción automática o el modelado del lenguaje) puede requerir la energía equivalente a volar de ida y vuelta de Nueva York a San Francisco… ¡300 veces (eso son, aproximadamente, 284 000 kilos de CO2)! La tecnología blockchain también es conocida por contribuir al aumento explosivo del consumo de energía: específicamente, los sistemas de prueba de trabajo como Bitcoin, que (según informa Harvard Business Review) requieren la misma energía que países enteros, como Suecia o Malasia.
Al mismo tiempo, usamos más dispositivos digitales que nunca. El número de dispositivos conectados a internet, incluyendo portátiles y teléfonos inteligentes, así como televisores inteligentes, asistentes domésticos y otros dispositivos IoT, está creciendo rápidamente y se espera que supere los 75 mil millones para 2025. Esto equivale a unos 10 dispositivos por persona en la Tierra (aunque la distribución global de estos dispositivos dista mucho de ser uniforme). A nivel mundial, la adopción de teléfonos inteligentes ha aumentado rápidamente, al igual que la demanda de los recursos necesarios para fabricar dispositivos nuevos que cada vez son más potentes. La producción de estos dispositivos, incluyendo la extracción de los metales de tierras raras necesarios para su funcionamiento, su transporte, uso y eliminación final, consume enormes cantidades de energía.
Es crucial destacar que el consumo de energía no es lo mismo que las emisiones de carbono. Las emisiones de carbono dependen de la combinación específica de combustibles utilizados para generar electricidad, denominada combinación de generación de electricidad o energía. Por ejemplo, para el suministro energético de la Unión Europea en 2016, la combinación de generación de energía incluía un 32,9 % de petróleo, un 23,9 % de gas, un 14,9 % de carbón, un 13,7 % de energía nuclear y un 14,5 % de energías renovables. Con la crisis energética de 2022, la combinación energética en la UE ha cambiado: en algunos casos para mejorar a largo plazo y en otros para empeorar a corto plazo. Las emisiones relativas de carbono dependerán de esta combinación: por ejemplo, el consumo de energía procedente de fuentes 100 % neutras en carbono no contribuye a las emisiones directas de CO2.
Daño relativo: O, cuando menos no es más
La digitalización suele asociarse con la «desmaterialización»: imprimir entradas para conciertos o viajes en papel ya no es necesario, pues se pueden descargar y visualizar en el teléfono inteligente; las fotografías ya no se guardan en cajas de zapatos abarrotadas, sino en una tableta o disco duro; miles de películas y series de televisión se reproducen en streaming en ordenadores portátiles, convirtiendo las colecciones de películas en algo del pasado. En muchos casos, un solo dispositivo, el teléfono inteligente, se usa para todo lo anterior… y mucho, mucho más.
Cada uno de esos objetos materiales fue en su día una parte fundamental de nuestra vida cotidiana… aunque hoy, sencillamente, ya no son necesarios. Eso debe ser mejor para el planeta, ¿no?
Si bien los dispositivos digitales pueden reducir algunos tipos de residuos, estimar el verdadero impacto ambiental de las tecnologías digitales requiere considerar todo el ciclo de vida de un artículo. Esto incluye los costes de producción y transporte de los dispositivos digitales (hasta y desde la tienda, así como hasta el vertedero), o los costes de remediar el daño ambiental causado por los residuos electrónicos. Esto es especialmente cierto al considerar la huella de carbono colectiva de nuestras tecnologías digitales, ya que, en algunos casos, la producción de dispositivos, junto con su transporte y tratamiento al final de su vida útil, genera más emisiones de gases de efecto invernadero que el uso de los dispositivos durante toda su vida útil. Para ilustrar esto, consideremos el Informe de responsabilidad ambiental de 2019 de Apple, que estima que Apple contribuyó con 25,2 millones de toneladas métricas de CO2 en 2018 (p. 9). La mayor parte de ellas —¡un impresionante ochenta por ciento!— proviene de la producción (74 %), el transporte (5 %) y el tratamiento al final de la vida útil (menos del 1 %). Solo el 19 % proviene del uso real de los dispositivos.
Entonces, ¿cuándo merece la pena asumir el coste de fabricar un dispositivo digital para sustituir todos esos objetos analógicos? El libro «Smarte Grüne Welt» (en español, Mundo verde inteligente), de Steffen Lange y Tilman Santarius (2018), explora la dificultad de cuantificar el daño ambiental relativo al intentar responder a esta pregunta. Considera este extracto, en el que los autores exploran el impacto ambiental de imprimir libros en papel frente a la fabricación de lectores electrónicos (págs. 29–31, traducido del alemán):
La fabricación de dispositivos electrónicos requiere, obviamente, más energía y recursos que la impresión de un solo libro. Por ejemplo, la producción de un lector electrónico, que suele pesar menos de 200 gramos, implica el uso de unos 15 kilogramos de diferentes materiales (especialmente metales no renovables y tierras raras), 300 litros de agua y 170 kilogramos de dióxido de carbono, un gas de efecto invernadero. Sin embargo, no solo son decisivas las cantidades de materiales utilizados, sino también su impacto ambiental. Existen grandes diferencias entre los lectores electrónicos y los libros, sobre todo en lo que respecta a la toxicidad de los materiales y los procesos de fabricación. Si bien es cierto que la industria papelera en muchos países aún tiene efectos ambientales muy negativos, por ejemplo, cuando el cloro o los ácidos contaminan las aguas locales, los efectos ambientales de la industria electrónica a veces son devastadores: los lectores electrónicos y otros productos informáticos contienen retardantes de llama bromados, ftalatos, berilio y muchas más sustancias químicas que son gravemente perjudiciales para la salud y el medio ambiente. Por no hablar de las consecuencias sociales, como las condiciones laborales a veces miserables en las que se extraen inicialmente el cobalto, el paladio, el tantalio y otros recursos de los dispositivos digitales en dictaduras, como la República del Congo y otros países del cono Sur, para luego acabar como desechos allí al final de su vida útil en forma de residuos electrónicos perjudiciales para el medio ambiente.
A pesar de todo esto, el lector electrónico puede ser mejor que el libro. Esto depende en última instancia de dos factores: ¿cuántos libros se leen en el lector electrónico a lo largo de su vida útil?, y ¿cuántas personas comparten el libro físico? Para que los altos costes ambientales de la producción del lector electrónico se compensen ecológicamente, se debe leer cierta cantidad de libros en él. Esto ocurre después de 30 a 60 libros, dependiendo del grosor del libro y del indicador ambiental. Si lees menos de esta cantidad de libros en un lector electrónico, es mejor optar por el formato en papel. Si superas esta cantidad, cada libro adicional en el lector electrónico es ecológicamente mejor que su equivalente en papel. Además, la forma en que se usan los objetos es crucial […]: si se supone que alguien compra un libro y no deja que nadie más lo lea, un archivo del lector electrónico es aproximadamente cinco veces más eficiente energéticamente que un libro. Sin embargo, esta ventaja desaparece cuando varias personas comparten un libro.

Entonces, ¿sustituir objetos físicos con tecnología digital reduce el impacto ambiental? Bueno, depende. Por ejemplo, si compras un lector electrónico, ¿leerás entre 30 y 60 libros antes de desecharlo? Una encuesta de Gallup mostró que, en 2021, el 50 % de los estadounidenses leyó menos de 5 libros al año, mientras que un 15 % leyó entre 6 y 10 libros. Esto significa que, para más de dos tercios de la población estadounidense, un lector electrónico se tendría que usar entre cinco y diez años para ser la opción más ecológica. Pero, ¿cuántos consumidores se cambian al siguiente dispositivo nuevo y reluciente mucho antes?
También merece la pena preguntarse si una empresa seguirá dando soporte a un dispositivo durante el tiempo necesario para que sea la opción menos perjudicial. A finales de 2022, la lista de la Wikipedia de lectores electrónicos discontinuados incluía 71 dispositivos. Según la lista, la vida útil promedio, es decir, desde el año de lanzamiento hasta el año de finalización, fue de 1,5 años, considerablemente más corta que un período mínimo de uso de cinco años, ¡y mucho menos que una década! ¿Cuántos de esos lectores electrónicos seguían funcionando y terminaron en un vertedero debido a la falta de soporte de software? Este tipo de obsolescencia del hardware contribuye significativamente al daño ambiental, ya sea en forma de residuos electrónicos o de emisiones de carbono asociadas a la producción del dispositivo. Como escriben Lange y Santarius: «es cuestionable que todos los lectores electrónicos vendidos, antes de que se averíen o vuelvan a quedar técnicamente obsoletos, se usen de forma tan intensiva en promedio para que se logre un beneficio ecológico general» (p. 31, traducido del alemán).
Un «tsunami de residuos electrónicos»
At seven meter’s tall, the “WEEE Man” is a giant. Taking its name from the 2003 Waste Electrical and Electronic Equipment (WEEE) directive, which sets collection, recycling, and recovery targets for e-waste in the EU,1 the statue is made from 3.3 metric tons of electrical waste, or the average amount of e-waste that one UK individual creates in a lifetime.

E-waste is considered the “fastest-growing waste stream in the world”, with 44.7 million metric tons generated in 2016—equivalent to 4,500 Eiffel Towers, which, when stacked, is 17 times higher than Mount Everest. In 2018, an estimated 50 million metric tons of e-waste was reported, motivating the UN to refer to a “tsunami of e-waste rolling out over the world”. The numbers continue to rise: in 2021, an estimated 57 million metric tons of e-waste was generated globally. Less than 20 percent of it is collected and recycled, and although it makes up only 2% of trash in landfills, it contributes to almost 70% of the toxic waste found there.

The environmental impacts of e-waste are enormous. Electronic scrap components like CPUs contain potentially harmful materials such as lead, cadmium, beryllium, or brominated flame retardants. The end of life treatment of e-waste can also involve significant risk to the health of workers and their communities. Scavengers risk their health for the discarded precious metals in laptops and smartphones “laced with lead, mercury or other toxic substances”. The process of dismantling and disposing of e-waste has led to a number of environmental impacts in developing countries. Liquid and atmospheric emissions end up in bodies of water, groundwater, soil, and air—and therefore, also in land and sea animals, in crops eaten by both animals and humans, and in drinking water. This pollution is a crucial aspect of digital technology’s environmental harm.
Mira el software
What is the cause of all this e-waste, and why do digital devices that still work end up in landfills? Software engineering has an important but often unseen role in driving our digital consumption patterns. Manufacturers regularly encourage consumers to purchase new devices, often unnecessarily; indeed, they may even enforce it through software design. Because of licensing restrictions on software use and vendor dependencies, end users can do little about it. In short, these are largely economic—and not technological—reasons for functioning hardware becoming e-waste.

Software lock-out and programmed obsolescence result in unusable hardware. Abandonware released under a proprietary license can, at best, leave users vulnerable to viruses and other malware, and, at worst, simply stop working, without any alternative. Underlying infrastructure which people may depend on to run an application—such as software license servers used for access control by software vendors—can go offline, sometimes permanently. Users may not be able to continue using “outdated” hardware even if they wanted to.
Feature creep and other forms of software bloat may render less-powerful hardware obsolete, even though costumers never requested the extra functionalities or might wish to remove them if they could. Consider the following:
“Processing power has doubled about every two years since 1970. This means that functions are processed twice as fast and thus less energy is required for the same functions. A similar improvement in efficiency cannot be observed in the field of software. […] The availability of more and more powerful hardware has resulted in software becoming more and more bloated from version to version so that more resources are required for only minimal or even no enhancement of the functionality.” — Blue Angel Award Criteria: Resource and Energy-Efficient Software Products (p. 5)
In these cases, vendor dependencies and user restrictions attributable to software design and licensing mean that still-functioning devices are tossed in the garbage heap while more resources are consumed to produce and transport new ones.
When not rendering functioning hardware obsolete, software design which requires license servers, suffers from feature creep, etc., also results in higher energy consumption while using the software. For example, a study published by the German Environment Agency and a related article found that two applications doing the same thing and achieving the same result may have drastically different energy profiles.

Data from the study includes a comparison of two word processing programs: Word Processor 1 is identified as Open Source, while Word Processor 2 is identified as a proprietary software product. Both computer programs ran the same sequence of commands through a Standard Usage Scenario (SUS) script, corresponding to “the most representative use of the respective software over a defined period of time” (p. 23). We’ll return to usage scenario scripting in the how-to in PART III of this handbook. For now, what’s important to note is the massive difference in energy use. Running Word Processor 2 consumed 4 times the energy compared to Word Processor 1— again, and this cannot be stressed enough, to do the same task!
Looking more closely at the two word processors’ power use over time, it’s also clear how the two programs behave quite differently … and perhaps contrary to what you might expect. Consider the plot below, in which power consumption is shown while running the usage scenario’s sequence of commands. At about the 440-second mark, the script calls for both word processors to save the document and then stops calling for further action. As you can see, Word Processor 1 goes idle (as one might expect). By contrast, Word Processor 2 continues working, consuming power even though the script has ended.

It’s worth asking what the additional activities from 440 to 600 seconds are for: Are the actions of Word Processor 2 necessary for the functionality of the software? Is the word processor collecting and transmitting user data? If so, do users have a way to opt out of these types of analytics? Indeed, user autonomy, such as the capability of turning off of unwanted data use, can make a big difference on the energy profile of a software product. Data mining, third-party tracking, personalized engagement-maximizing algorithms, and advertising are significant drivers of energy consumption. Collecting and analyzing user data and training algorithms on it require computing power and infrastructure.
Researchers in the EU have estimated the environmental costs of tracking and advertisements that users cannot opt out of, referred to as “unwanted data use” in the 2021 report “Carbon footprint of unwanted data-use by smartphones: An analysis for the EU”. The carbon footprint of this smartphone tracking—between 3 and 8 million metric tons a year in the EU alone—is “equal to the carbon footprint of between 370 and 950 thousand EU citizens” (at its worst, roughly the annual footprint of a city like Turin or Lisbon). The report points out that about 60% of European smartphone users say they would opt out of tracking and block advertisements when possible. That’s an awful lot of energy consumption for something most users don’t want in the first place!
«Lo contrario es la verdad»: La paradoja de Jevons
Increases in software efficiency alone do not necessarily translate to lighter environmental footprints. For example, the “rebound effect” (also known as the “take-back effect”) describes how efficiency improvements can lead to changes in usage that decrease or even negate the original gains.
Imagine that a change in software results in a 5% improvement in energy efficiency. However, because of the increased energy savings, you might end up using the software more, leading to less energy savings overall. Let’s say that due to your increased usage, the overall energy usage of the software drops by just 1%. In this case, the rebound effect is 80% ((5-1)/5): in other words, those original efficiency gains have decreased by 80%, practically negating any savings from the improvements!
If the rebound effect goes over 100%, meaning more energy ends up being used than before, this is referred to as Jevons’ Paradox, or “back-fire”. The concept comes from the English economist William Stanley Jevons, who in 1865 recognized that technological improvements in coal-use actually increased coal consumption across industries. Jevons concluded that:
“It is a confusion of ideas to suppose that the economical use of fuel is equivalent to diminished consumption. The very contrary is the truth.” [emphasis added]
A practical interpretation of this paradox is that efficiency gains must be combined with conservation practices in order to have a meaningful effect, lest one ends up consuming more than before. The ACM report from the beginning of this section makes a similar point: “Computing-enabled efficiencies must be coupled with slashed energy demand to reduce ICT sector carbon emissions” (p. 1). In other words, both software engineering AND user behavior are crucial elements to consider when combatting the environmental harm driven by software.
¿Merece la pena todo esto?
Looking at the bigger picture, software-driven environmental harm and global greenhouse gas emissions may be less significant when compared to other industries. Therefore it seems reasonable to ask: Is it worth focusing on the environmental impacts from software, a problem that might appear relatively small in the grand scheme of things?
There are a few things we might consider here. The first is a rejection of the “Not As Bad As” fallacy, also known as “Appeal to Worse Problems”. The general argument is so: software’s contributions to global CO2 emissions may not be as bad as another industry’s, and therefore it is not worth focusing on. What’s wrong with this argument is that although another industry may be worse, this does not negate the fact that software engineering is responsible for causing serious environmental harm. What’s more, the “Not As Bad As” fallacy suggests a false choice between addressing either one problem or the other, when in fact ecologically-friendly software design is just one piece of a bigger puzzle.
Let’s not be like XKCD’s White Hat, and appeal to worse problems as an excuse not to do anything!

Second, focusing only on fixing the “biggest problem” is not necessarily the most effective strategy. It’s also important to weigh the likelihood of success when addressing an issue, as well as the time and resources required to do so. Free & Open Source Software, with its focus on user autonomy and transparency, provides unique opportunities for users, communities, and organizations to directly address intertwined social and ecological issues. FOSS can be adapted, updated, and maintained at lower cost and without vendor dependencies or artificial restrictions.
Third, it’s hopefully clear by now that software does have significant impacts on energy consumption and the production of waste, both of which have consequences for the environment. Moreover, when considered at scale minimal changes in software design can result in savings comparable to the annual energy consumption of entire cities. This claim is based on an example by SAP Product Engineer Detlef Thoms, who does back-of-the-envelope calculations (04:20–06:10) to go from a one CPU-second reduction, equivalent to about a 10 watt-second savings, to 95 thousand megawatt hour savings simply by scaling up. These savings are comparable to the annual energy consumption of over 30-thousand two-person households.


As Detlef Thoms states in the video: “Often, it is a quite manageable set of decisions which lead to significant differences in power consumption”.
Finally, in order to make claims about relative harm, it is necessary to first have estimates about actual effects. Since research in the area of software’s energy and resource consumption is still quite new, we often do not have data to make data-driven claims. With this handbook, and with the Blue Angel ecolabel as a guide, KDE hopes to help change that.
Changing our software may seem like a small gesture in addressing an issue as complex as climate change. It’s also clear that simply changing our individual consumption patterns may not be sufficient on its own (worse, evidence suggests that major contributors to global greenhouse gas emissions—such as ExxonMobile—have embraced a rhetoric of consumer individual responsibility in order to deflect from their own role in the crisis). It’s true: a zero-emissions future will require fundamental shifts in how we live, and that responsibility cannot be managed at an individual level. But consider what anthropologist Margaret Mead once observed:
«Nunca dudes de que un pequeño grupo de ciudadanos reflexivos y comprometidos puede cambiar el mundo; de hecho, es lo único que lo ha logrado».
Structural change happens when dedicated, passionate people organize to confront pressing societal issues. With decades of experience successfully bringing global communities together to work toward common goals, Free & Open Source Software can be a powerful force for combatting the environmental impact of digitization. We know how to organize—now, it’s a matter of turning plans into practice, goals into reality. Let’s unite to combat software-driven environmental harm. Let’s foster a culture of digital sustainability in our software communities. Let’s build energy and resource efficient software, together!
Una nota sobre las fuentes
Parte del material de esta sección está basado directamente en textos de dos artículos de la Wikipedia: (i) «Directiva de Residuos de Aparatos Eléctricos y Electrónicos» y (ii) «Chatarra electrónica». Ambos textos están publicados bajo la Creative Commons Attribution-Share-Alike License 3.0.
Parte II: Software de escritorio ecocertificado

¿Qué tienen en común los productos de construcción, el papel higiénico y el software?
Todos ellos pueden obtener la certificación ecológica del sello ambiental Blue Angel, ¡el sello ambiental oficial del gobierno alemán!
La etiqueta ecológica Blue Angel se otorga a una amplia gama de productos y servicios, desde productos de papel y materiales de construcción hasta impresoras, y certifica que el producto cumple con una serie de requisitos estrictos para ser respetuoso con el medio ambiente a lo largo de su ciclo de vida. En 2020, la Agencia Federal de Medio Ambiente de Alemania amplió los criterios de la certificación para incluir productos de software, convirtiéndose en la primera certificación ambiental en vincular la transparencia y la autonomía del usuario con la sostenibilidad.
En concreto, los criterios de certificación ecológica exigen transparencia sobre el consumo energético del software durante su uso, garantizando además su compatibilidad con hardware antiguo. Asimismo, incluyen una serie de requisitos relacionados con la autonomía del usuario que pueden reducir el impacto ambiental del software.
Esta sección ofrece una visión general del galardón Blue Angel y los fundamentos de los criterios para premiar el software de escritorio. También muestra cómo el cumplimiento de dichos criterios puede reducir el impacto ambiental. En particular, analizaremos en detalle los requisitos de autonomía del usuario de Blue Angel, tema que retomaremos en la Parte III. Pero antes haremos una breve introducción a Blue Angel y a la iniciativa KDE Eco.
La Blue Angel para el software de escritorio
Presentado en 1978, la «Blue Angel» es la primera ecoetiqueta del mundo y el sello medioambiental oficial otorgado por el gobierno alemán. La gestión de la etiqueta corre a cargo del Ministerio Federal de Medio Ambiente, Conservación de la Naturaleza, Seguridad Nuclear y Protección del Consumidor de Alemania (en alemán, Bundesministerium für Umwelt, Naturschutz, nukleare Sicherheit und Verbraucherschutz, o BMUV). La ecoetiqueta «Blue Angel» también es miembro de la Global Ecolabelling Network (GEN), una red internacional de ecoetiquetas de «Tipo I» que, en el momento de escribir este documento tiene 37 miembros en casi 60 países.

The Blue Angel was not the first Type I ecolabel for software—the Hong Kong Green Council, also a member of the Global Ecolabelling Network, released criteria in 2010 for Green IT software. But the Blue Angel ecolabel criteria are the first to identify a process for measuring software’s energy consumption and to specify ways that user independence reduces environmental harm.
You may be wondering: What is a Type I environmental label? For these ecolabels, the entire life cycle of the product is taken into account. Furthermore, compliance with the award criteria is assessed by a third-party. (Compliance with Type II environmental labels, by comparison, is self-declared and do not necessitate any third-party auditing.)
The Blue Angel ecolabel has been awarded to around 100 product groups and services across a variety of sectors, including paper and construction products, furnishings, clothing, washing and cleaning agents, cleaning services, household chemicals, packaging, vehicles, energy and heating, and household electrical devices. As of 2022, with the eco-certification of KDE’s PDF and universal document reader Okular, that list also includes desktop software.
The award criteria for certification are developed transparently by the German Environment Agency. The process includes the Environmental Label Jury, a body made up of suppliers as well as civil society organizations and research institutions. The independent third-party auditor RAL gGmbH assesses compliance with the criteria and awards the seal. Importantly, the Blue Angel does not certify that a product is completely harmless. Instead, certified products represent a “lesser evil” with respect to environmental harm—this can be summed up with the motto ’as little as possible, as much as necessary’. Rather than compare different products, the Blue Angel ecolabel indicates that a product fulfills a list of requirements for a specific category.
Los fundamentos de los criterios del galardón
The Blue Angel’s award criteria for “Resource and Energy-Efficient Software Products” were released in January 2020. There are two primary objectives of the Blue Angel for software: (i) to award software with lower performance requirements such that “longer operating lives for […] hardware are possible”; and (ii) to recognize products which “stand out due to their high level of transparency and give users greater freedom in their use of the software” (p. 6). To achieve this, there are three main categories, referred to here as the ABCs of the award criteria: (A) Resource & Energy Efficiency, (B) Potential Hardware Operating Life, (C) User Autonomy.

The criteria in category (A) requires that the energy consumption of a software product be measured and reported, and states that the energy consumption of the application cannot increase by more than 10% from the time of its certification. Energy consumption data is measured using an external power meter and accounts for other hardware performance information, such as CPU usage or network traffic, while running the software in a representative way. We will return to this in PART III.
The criteria in category (B) ensure that the software has low-enough performance requirements to run on older, less powerful hardware at least five years old. Compliance entails a declaration of backward compatibility, with details about the hardware on which the software runs and the required software stack.
Finally, the criteria in category (C) ensure that users have an influence on the energy consumption and resource-conserving use of their software. There are eight categories for the autonomy criteria.
Formatos de datos: Interoperabilidad para ofrecer opciones a los usuarios
Data formats should not be used by vendors to lock users into using a specific computer program, nor should they impose onerous switching costs. Interoperable data formats prevent users from being stuck using a program that consumes a high amount of energy, when a more efficient program can achieve the same results with fewer hardware demands. Users should be able to easily change programs and still access all of their data.
Transparencia: Eliminación de dependencias del usuario para un uso a largo plazo
Transparency in software code and application interfaces means removing any dependencies on a particular company or organization. It also means removing restrictions on the short and long-term use of the software, and thus hardware. When developers decide to end support for their software, either security updates should continue to be provided (see below) or the source code should be made publicly available so third parties can continue providing support for the software. Furthermore, enhancing the functionality of software must not be limited by restrictive or undocumented application interfaces (APIs).
Continuidad del soporte: Actualizaciones de seguridad para prevenir los residuos electrónicos
Depending on suppliers for essential updates should not result in abandoned software products that cannot be used without presenting serious disadvantages for the users, such as vulnerabilities to malware. Security updates should be provided for up to five years after software development is discontinued. Moreover, security updates should be separable from feature updates so that users are not coerced into adopting unwanted functionalities, e.g., feature creep and other forms of bloat. Such abandonware and software bloat leave hardware unusable and produce unnecessary e-waste.
Desinstalabilidad: Eliminación del software no deseado para aumentar la eficiencia
Being able to completely uninstall software that is not needed has ecological benefits. Software bloat, feature creep, and unwanted software components can create inefficiencies by occupying memory, wasting processing time, adding disk usage, consuming storage, and causing delays at system startup and shutdown. When a user no longer wishes to continue using a computer program, it must be possible to completely purge it from the system while keeping all user-generated data.
Capacidad sin conexión: Para evitar dependencias y disminuir el consumo energético
Use of the software should be possible without an internet connection—unless, of course, a network connection is necessary for the software’s intended functionality. License servers and other forms of access control restrict the use of an application in ways that are unnecessary to the software’s intended functionality. When a server goes down or there is Internet outage, such access control prevents people from using their software, possibly permanently. Moreover, such dependencies require network traffic and thus consume energy beyond that which is needed for the intended purpose of the software.
Modularidad: Para disminuir las demandas de memoria y energía
Users should be able to install only what they need. Non-essential functions increase memory and energy demands, making the software less efficient and perhaps unable to run on older hardware. People should have the ability to limit the range of software functions to those that they either want or require.
Libertad frente a la publicidad: Optar por no participar para reducir el consumo de energía
Unwanted data use in the European Union alone is roughly equivalent to the annual energy consumption of a city like Lisbon or Turin; see PART I. Allowing users to opt out of ads reduces energy and resource demands on end-user devices and on the servers running the ads. Opting out also decreases data volume transmitted and thus reduces the energy consumption for network traffic.
Documentación: Para apoyar la conservación de recursos y el uso continuado del software… y, por lo tanto, del hardware
Documentation is a prerequisite for the long-term viability of a software product. Documentation must also demonstrate the software’s capacity for conserving resources. By documenting the criteria listed above, users can continue using software—and thus, hardware—in a sustainable way, while developers can maintain the software without dependencies or restrictions imposed by vendors.
Software design that complies with the award criteria is less likely to suffer from various forms of inefficiencies. This in turn can help mitigate the problem of e-waste: with software that doesn’t drive early hardware obsolescence, fewer devices need to be produced and shipped, which means fewer valuable metals that need to be mined and processed, which in turn results in a reduction of water and soil pollution. By ensuring user autonomy, developers can ensure that their software reduces environmental harm in more ways than one—whether by keeping devices in use for longer, or by reducing the software’s use of energy and resources while in use.
With its focus on transparency in resource and energy-efficiency, hardware operating life, and user autonomy, the Blue Angel award criteria for software provides a comprehensive framework to begin a discussion around software sustainability. In FOSS communities, we often take user autonomy and transparency and their benefits for granted. Although being Free & Open Source Software is not a requirement to obtain the Blue Angel ecolabel, it is in this category that FOSS really shines. In so many ways, we are already at the forefront of sustainable software design!
Okular, el primer programa informático ecocertificado

In 2022, Okular, el popular lector de PDF multiplataforma y visor de documentos universal de KDE, fue el primer producto de software reconocido oficialmente por su diseño sostenible, según los criterios del galardón Blue Angel. Además, Okular es el primer programa informático con certificación ecológica dentro de la Red Global de Etiquetado Ecológico.
Okular es solo uno de los productos de software mantenidos por KDE, una comunidad mundial de ingenieros de software, artistas, escritores, traductores y creadores comprometidos con el desarrollo de software libre. KDE mantiene numerosos productos de software libre, incluido el entorno de escritorio Plasma; el programa de diseño para pintores y artistas gráficos, Krita; el conjunto de actividades educativas para niños, GCompris; Kdenlive, un producto de software de edición de video profesional; y, por supuesto, Okular, un visor de documentos para PDF, cómics, escritos científicos y académicos, así como dibujos técnicos.
Con la duradera misión y visión que KDE ha mantenido desde su fundación en 1996, así como el talento y las capacidades de sus miembros, KDE es pionera en la promoción del software sostenible. En 2021, KDE inició KDE Eco, un proyecto con el objetivo de posicionar a KDE y al software libre a la vanguardia del diseño de software sostenible. La sostenibilidad no es un concepto nuevo para el software libre y de código abierto (FOSS): las cuatro libertades siempre han hecho que el software libre sea software sostenible. Sin embargo, ahora, los dos pilares del FOSS —la transparencia y la autonomía del usuario— gozan de un mayor reconocimiento por su impacto en la sostenibilidad, y se han incorporado a los criterios de sostenibilidad establecidos por la Agencia Federal de Medio Ambiente de Alemania mediante la etiqueta ecológica Blue Angel.

Con el primer producto de software con certificación ecológica, la comunidad de KDE celebró el logro junto con la comunidad de software libre en general, así como con el departamento de ciencias de la computación en el Umwelt Campus Birkenfeld, donde los investigadores midieron el consumo de recursos y de energía de Okular y de otros programas de KDE.
Los criterios del galardón Blue Angel reflejan a la perfección los valores de KDE y del movimiento FOSS en general. El software libre y de código abierto garantiza la transparencia y otorga el control al usuario, en lugar de obligarlo a trabajar con determinados proveedores o prestadores de servicios. Esto permite al usuario decidir qué quiere del software que utiliza y, a su vez, tomar decisiones sobre el hardware que usa. El usuario puede reducir el consumo de energía de sus programas con poca o ninguna pérdida de funcionalidad, instalando solo lo que necesita, ni más ni menos; también puede evitar la publicidad invasiva y las opciones de minería de datos que ejecutan procesos en segundo plano, consumiendo aún más recursos en el dispositivo y en la red. En cuanto a los desarrolladores de FOSS, suelen seguir dando soporte a hardware que la industria desearía dejar obsoleto, proporcionando al usuario software actualizado y seguro para dispositivos que, de otro modo, podrían desecharse como residuos electrónicos y acabar contaminando los vertederos.
Publicado bajo la licencia GPLv2+, Okular es software libre y, por lo tanto, ya cumple con muchos de los criterios de autonomía del usuario necesarios para obtener el sello de aprobación Blue Angel. Se han realizado trabajos adicionales para que Okular cumpliera plenamente con los criterios del galardón, documentando las funciones de autonomía del usuario, proporcionando transparencia en el consumo de energía y recursos, y apoyando la posible extensión de la vida útil del hardware de los dispositivos.

Okular permite verificar firmas digitales y firmar documentos, así como incluir texto anotado y comentarios directamente en el documento. Okular funciona en Linux, Windows, Android y Plasma Mobile, y está disponible para su descarga en todas las distribuciones GNU/Linux, como paquete independiente en Flathub y la Snap Store, a través del repositorio de lanzamientos de KDE de F-Droid para Android, y también en la Microsoft Store. El código fuente también está disponible en el repositorio GitLab de Okular para que todos puedan usarlo, estudiarlo, compartirlo, mejorarlo y, sobre todo, disfrutarlo.
KDE y la comunidad de software libre desean enviar un sincero agradecimiento a los desarrolladores de Okular por crear un software respetuoso con el medio ambiente para todos nosotros.
En la Parte III de este manual, analizaremos los pasos necesarios para que tu proyecto de software libre sea reconocido por su diseño sostenible. Pero antes, ¿cuáles son exactamente los beneficios de obtener la Blue Angel?
Beneficios de Blue Angel
Steffi Lemke, el Ministro Federal de Medio Ambiente, Conservación de la Naturaleza, Seguridad Nuclear y Protección del Consumidor (BMUV), ha dicho esto sobre la reputación de Blue Angel:
Cada vez más personas priorizan la durabilidad y el respeto al medio ambiente al comprar productos. Esto es precisamente lo que representa la Blue Angel. Esta ecoetiqueta lleva 40 años garantizando altos estándares de protección para nuestro medio ambiente y nuestra salud de forma independiente y creíble.
De hecho, en su folleto informativo del 40.º aniversario «Blue Angel: 40 años. Bueno para mí. Bueno para el medio ambiente», la Agencia Federal de Medio Ambiente de Alemania (UBA) explora la historia, el presente y el futuro de la etiqueta ecológica. En el folleto, identifican algunos de los criterios generales que consideran al certificar ecológicamente un producto, como:
- reducción de las emisiones de sustancias nocivas en el suelo, el aire, el agua y en interiores;
- producción sostenible de recursos;
- longevidad, capacidad de reparación y reciclaje del producto; y
- uso eficiente (por ejemplo, productos que ahorran energía).
Al llegar al final de esta sección, esperamos que quede claro cómo el cumplimiento de los criterios del galardón Blue Angel para software de escritorio promueve, entre otros, los beneficios ambientales mencionados anteriormente.
Las etiquetas ambientales pueden ser un instrumento para orientar los mercados hacia productos sostenibles. Como indica el sitio web de Blue Angel: «El objetivo de la etiqueta ambiental es proporcionar a los consumidores particulares, a las grandes instituciones y a las entidades públicas una guía fiable para realizar compras respetuosas con el medio ambiente».
¿Y qué dice el mercado?
Una encuesta, cuyo resultado se incluye en el folleto informativo, reveló que el 92 % de los alemanes reconoce la etiqueta ecológica, y para el 37 % influye en sus decisiones de compra. ¡La etiqueta ecológica también se reconoce fuera de Alemania! Hasta el 15 % de los galardonados con la Blue Angel se encuentran fuera de Alemania. Esto se debe, en parte, a que, a diferencia de otras etiquetas ecológicas, la Blue Angel no impone restricciones sobre dónde se puede comercializar un producto. Además, el sello de Blue Angel se considera un distintivo de alta calidad a nivel internacional, y los criterios del galardón se interpretan como un indicador de la dirección del mercado de la UE: en ocasiones, incluso se usan como guía para optimizar los productos.
Receiving the Blue Angel seal can raise your product’s profile not only among individuals, but also among large organizations. Green Public Procurement (GPP) initiatives, which “seek to promote the public procurement of goods, services, and works with a reduced environmental impact throughout their life-cycle” (European Commission), influence purchasing choices both in the public and private sector. Eco-certifying your software product with the Blue Angel demonstrates a commitment to long-term digital sustainability, and it gives your product visibility both in Germany and abroad.
Una nota sobre las fuentes
Some material in this section is based directly on text from two Wikipedia articles: (i) “Blue Angel (certification)” and (ii) “Software bloat”. Both texts are released under the Creative Commons Attribution-Share-Alike License 3.0. Some material in this section is also based directly on the KDE Eco blog post “First Ever Eco-Certified Computer Program: KDE’s Popular PDF Reader Okular”, which is released under the Creative Commons Attribution-ShareAlike 4.0 International License.
Parte III: Cumplimiento de los criterios del galardón Blue Angel

LabPlot. (Image from Alexander Semke published under a CC-BY-NC-ND-4.0 license.)
Las tres categorías principales de los criterios del premio Blue Angel para software de escritorio son:
- (A) Eficiencia energética y de recursos
- (B) Vida útil potencial del hardware
- (C) Autonomía del usuario
In this section we’ll provide a hands-on guide to fulfilling each set of criteria. There are numerous benefits of meeting the basic award criteria. By making the energy consumption of your software transparent and complying with the hardware operating life and user autonomy criteria, you get the benefits of:
- Eco-Certification: Apply for the Blue Angel ecolabel to demonstrate to users, companies, and governmental organizations that your software is designed sustainably.
- Data-Driven Development: Locate inefficiencies in terms of energy and hardware consumption, and make data-driven decisions for your software development.
- Sustainable Design: For the long-term sustainable use of software, and thus hardware, take the user autonomy criteria into consideration when planning your software design.
- End-User Information: Highlight to your users the ways your software is already sustainably designed by using the Blue Angel criteria as a benchmark.

(A) Cómo medir el consumo de tu software
The laboratory setup consists of a power meter, a computer to aggregate and evaluate the power meter output, and a desktop computer for the system under test where user behavior is emulated. The setup described here follows the specifications from the “Blue Angel Basic Award Criteria for Resource and Energy-Efficient Software Products”.
Terminology comes in part from Kern et al. (2018): “Sustainable software products — Towards assessment criteria for resource and energy efficiency”.
Consulta también los siguientes recursos del Umwelt Campus Birkenfeld:
- Seiwert & Zaczyk (2021): «Projektbericht: Ressourceneffiziente Softwaresysteme am Beispiel von KDE-Software» (solo en alemán)
- Mai (2021): «Vergleichende Analyse und Bewertung von Betriebssystemen hinsichtlich ihrer Energieeffizienz» (solo en alemán)
- «Manual de OSCAR» (solo en alemán)
Descripción general de la configuración del laboratorio
La configuración del laboratorio requiere 1 medidor de consumo y al menos 2 computadoras:
Dispositivos de medición de energía
Uno de los dispositivos recomendados por la «Blue Angel» es la Gude Expert Power Control 1202 Series (manual). Proporciona tomas de corriente para alimentar la computadora y mide el consumo de corriente durante su funcionamiento. El dispositivo se puede controlar y leer mediante conexión Ethernet por cable. Dispone de una interfaz de usuario basada en web, una API REST y es compatible con diversos protocolos, como SNMP y syslog.
Computadora 1: Agregador y evaluador de datos
Este equipo se usará para recopilar y evaluar los resultados del medidor de consumo.
Un script de Python para leer los datos de la «Gude Expert Power Control 1202 Series» está disponible en el repositorio de FEEP.
Se recomienda supervisar el proceso en tiempo real con el segundo equipo para garantizar que todo transcurra sin problemas. Esto se puede hacer, por ejemplo, con Labplot de KDE. Aquí tienes más información.
Otros medidores de consumo pueden requerir software no libre, como el software de monitorización de la red eléctrica GridVis, de Janitza.

Computadora 2: Sistema bajo prueba
The reference system is the hardware used to measure the energy consumption of the “system under test”, or SUT. The SUT includes the operating system and software installed for (i) testing the software product, (ii) emulating the standard usage scenario2 and (iii) collecting the hardware performance results.
Hay que tener en cuenta lo siguiente:
- For GNU/Linux systems, the Blue Angel criteria (Section 1.1) require one of several Fujitsu computers as the reference system.
- For emulating activity in the standard usage scenario, Free Software task automation tools such as
xdotool,KDE Eco Tester(in progress), orActiona(GPLv3) can be used. - For collecting hardware performance data (e.g., processor and RAM utilization, hard disk activity, network traffic), the Free Software tool
Collectl(GPLv2/Artistic License) is available. - It’s also possible to repurpose cheap switchable power plugs as measurement devices; see Section “Alternative: Gosund SP111 Setup” for set up instructions.

Sistema bajo prueba (SUT)
For instance, the Fujitsu Esprimo P920 Desktop-PC proGreen selection (Intel Core i5-4570 3,6GHz, 4GB RAM, 500GB HDD) is one of the recommended reference systems; see Appendix D in the award criteria for other recommended Fujitsu systems.
On the reference system you need to set up the SUT, i.e., the system on which you will test the software. The SUT must reduce unrelated energy consumption and have a standardized configuration. Recommended is the following:
- Sobrescribe todo el disco duro de la máquina con un SO estandarizado.
- Desactiva todos los posibles procesos en segundo plano (actualizaciones automáticas, copias de seguridad, indexación, etc.).
- Instala el software necesario (es decir, la aplicación que se va a medir), así como el software de emulación del usuario (por ejemplo,
xdotool) y de datos del rendimiento del hardware (por ejemplo,Collectl). - Al ejecutar los scripts del escenario de uso, se debe borrar la caché entre ejecuciones y eliminar cualquier archivo nuevo antes de comenzar la siguiente medición.
Preparación del escenario de uso estándar (SUS)
La preparación del SUS requiere lo siguiente:
- Identificación de las tareas que suele llevar a cabo el usuario cuando usa la aplicación en consideración.
- Identificación de las funcionalidades que requieren una alta demanda de energía o un elevado uso de recursos.
- Basado en lo anterior, planificación de un diagrama de flujo de las acciones individuales y emulación de estas acciones con una herramienta de automatización de tareas.
- Se recomienda la programación de un intervalo de espera de 60 segundos antes de empezar la medición.
- Ejecución del SUS durante al menos 5 minutos.

An automation tool is needed to run the usage scenarios so as not to require human intervention. In this way the script can be run repeatedly in a well-defined manner to provide accurate measurements.
Example tasks and functions tested in the SUS for KDE’s email client KMail include searching for an email, writing a reply or forwarding the email, saving an attachment, deleting a folder in the mail client, etc. See the Actiona scripts used to test Krita and Okular for further examples.
Important: If the emulation tool uses pixel coordinates to store the position of the automated clicks (e.g., Actiona) and, moreover, the screen resolution of the computer used in preparation differs from that of the laboratory computer, all pixel coordinates will have to be reset for the laboratory environment.
Más herramientas de emulación
Beyond xdotool, KDE Eco Tester (in progress), or Actiona, there are other candidates for tools which might meet the requirements. See a list from KDE Contributor David Hurka in the presentation “Visual Workflow Automation Tools”. Most of the tools use X11-specific features, and thus do not work on Wayland systems. There are a few possible approaches here:
- Selenium Webdriver using AT-SPI (currently in testing for Season of KDE 2023)
- Portal RemoteDesktop de XDG
- Diversos protocolos de Wayland (su implementación varía según los compositores):
- Dispositivos de usuario de libinput
Proceso de medición
The measurement process is defined in Appendix A of the Basic Award Criteria. It requires recording and logging energy data and performance indicators with a granularity of 1-second so that they can be processed and average values can be calculated.
Algunos comentarios generales:
- Times between the PM and DAE must be synchronized.
- When using
Collectlto collect performance load, ensure it is running in the console of the SUT; also, check that the required CSV file is correctly generated before testing. - Since each run of the usage scenarios results in changes to the standard operating system, clearing the cache between runs is recommended.
- All runs (Baseline, Idle Mode, Standard Usage Scenario) must be for the same length of time, based on the time needed to run the usage scenario script.
- On the DAE you may want to confirm that the desired power outlet is read out correctly before and/or during testing (e.g., with a live graph using
LabPlot).
During the energy measurements, Collectl is used to record a set of performance indicators: processor utilisation, RAM utilisation, hard disk activity, and network traffic. Use the following command to obtain this hardware performance data:
$ collectl -s cdmn -i1 -P --sep 59 -f ~/<ruta/a/archivo>.csv
Las opciones son las siguientes:
-s cdmnrecopila datos de la CPU, del disco, de la memoria y de la red
-i1intervalo de muestreo de 1 segundo
-Psalida en formato de gráfico (datos separados que constan de una cabecera con una línea por intervalo de muestreo)
--sep 59usar un punto y coma como separador
-f </ruta/a/archivo>.csvruta del archivo donde se guardaran los datos
Measuring Baseline, Idle Mode, And Standard Usage Scenarios
Baseline Scenario: Operating System (OS)
To establish the baseline, a scenario is measured in which the OS is running but no actions are taken.
Idle Mode Scenario: OS + Application While Idle
To establish the energy consumption and hardware performance data of the application while idle, a scenario is measured in which the application under consideration is opened but no action is taken.
Important: the baseline and idle mode must be run for the same time needed to carry out the standard usage scenario. Since the power consumption for the baseline and idle scenario is relatively uniform, 10 repetitions for each is considered sufficient to obtain a representative sample (Seiwert & Zaczyk 2021).
Escenario de uso estándar: SO + aplicación en uso
To measure the energy consumption and hardware performance data of the application in use, the standard usage scenario should be run; see SUS preparation notes above. The measurement of the standard usage scenario should be repeated 30 times, which will take several hours to complete. The higher number of repetitions is necessary to obtain a representative sample as the energy consumption and performance data may vary across measurements.
Monitorización de la salida con Labplot
You can use KDE’s LabPlot to monitor the output live as data is coming in. To do this:
- Redirect the power meter output to a CSV file.
- In LabPlot, import the CSV file by selecting
File > Add New > Live Data Source… - Under “Filter”, select the Custom option. Under “Data Format”, define the separator value used (e.g., comma, semi-colon, space).
- You can check that the output is correct under the “Preview” tab.
- If everything looks good, click OK.
- Finally, right-click on the data frame window and selecting
Plot Data > xy-Curve.
Análisis del resultado con OSCAR
Tras obtener el resultado, el Umwelt Campus Birkenfeld proporciona una útil herramienta para generar informes llamada OSCAR (Open source Software Consumption Analysis in R):
See also the OSCAR Manual with detailed instructions, including additional screenshots on how to use OSCAR.
Archivos CSV
El análisis con OSCAR requiere el envío de los siguientes archivos al sitio web de OSCAR:
- (i) un archivo de registro de las acciones realizadas,
- (ii) los datos del consumo de energía y
- (iii) los datos de rendimiento del hardware.
Todos los archivos deben estar en formato CSV. Es posible que sea necesario cierto preprocesamiento de los datos en bruto (por ejemplo, los datos de rendimiento medidos por Collectl; se describe más abajo).
Important: OSCAR is very particular about data frame formats, including column names and cell values. The tables here provide examples which are confirmed to work. If you are having issues generating a report from your CSV files, make sure CSV files are as similar as possible to those shown here.
If you just want to test OSCAR, you can download data for Okular in this ZIP file. The data are confirmed to successfully generate a report using OSCAR v0.190404. The report which was generated can also be downloaded at the FEEP repository.
Archivo de registro de las acciones
The log file of actions should have the following format. Note the columns are separated by a semi-colon. Also, columns have no names (i.e., there is no header in the CSV file). Note that the start and end of each iteration must be labelled with ‘startTestrun’ and ‘stopTestrun’ in the second column, whereas the actions can be listed with any name.
| AAAA-MM-DD HH:MM:SS ; | startTestrun ; | |
| AAAA-MM-DD HH:MM:SS ; | ; | action1 |
| AAAA-MM-DD HH:MM:SS ; | ; | action2 |
| AAAA-MM-DD HH:MM:SS ; | ; | action3 |
| AAAA-MM-DD HH:MM:SS ; | stopTestrun ; |
An example log file of actions for measuring KDE’s text and code editor Kate. The (i) date and time as well as (ii) start and stop times and (iii) actions are listed in three columns.
| 2022-05-21 18:54:36 ; | startTestrun ; | |
| 2022-05-21 18:55:41 ; | ; | ir a la línea 100 |
| 2022-05-21 18:55:46 ; | ; | conmutar comentario |
| 2022-05-21 18:55:50 ; | ; | encontrar kconfig |
| 2022-05-21 18:55:55 ; | ; | cambiar entre búsquedas 6 veces |
| 2022-05-21 18:56:05 ; | ; | cerrar la barra de búsqueda |
| 2022-05-21 18:56:05 ; | ; | 30 segundos en espera |
| 2022-05-21 18:56:35 ; | ; | ir a la línea 200 |
| 2022-05-21 18:56:40 ; | ; | seleccionar 10 líneas |
| 2022-05-21 18:56:43 ; | ; | borrar el texto seleccionado |
| […] ; | ; | […] |
| 2022-05-21 18:59:13 ; | stopTestrun ; |
Datos del consumo de energía
The energy consumption data has the following format: the first column is the row number, the second column is the date and time in one-second increments, and the third column is the measurement output in Watts. Note that the following is confirmed to work with OSCAR: (i) the second and third column names as written below (i.e., “Zeit” and “Wert 1-avg[W]”), (ii) the date-time as a character string with the date and time separated by a comma, and (iii) no string delimiter used in the CSV file.
| ; | Zeit ; | Wert 1-avg[W] |
|---|---|---|
| 1 ; | DD.MM.AA, HH:MM:SS ; | value1 |
| 2 ; | DD.MM.AA, HH:MM:SS ; | value2 |
| 3 ; | DD.MM.AA, HH:MM:SS ; | value3 |
| 4 ; | DD.MM.AA, HH:MM:SS ; | value4 |
When using the Gude Power Meter with the Python script available at the FEEP repository, the timestamp will be recorded in nanoseconds in Epoch time. For instance, below is an example of the raw output for 7 rows from the Gude Power Meter output using the Python script. The first column shows the timestamp. The second column is the readout from the power meter in Watts.
| 1661611923019071 ; | 43 |
| 1661611923142924 ; | 43 |
| 1661611924293989 ; | 29 |
| 1661611924417017 ; | 28 |
| 1661611924744885 ; | 28 |
| 1661611924869051 ; | 28 |
| 1661611924992392 ; | 28 |
The raw data can be preprocessed in R: Nanoseconds in Epoch time can be converted to date-time with the command as.POSIXct(<NANOSECONDS>/1000000, origin = '1970-01-01', tz = 'Europe/Berlin'). For example, the nanoseconds in row 1 from the raw output is “2022-08-27 16:52:03 CEST” after conversion.
For use with OSCAR, this date-time should then be converted to a character string with the date as DD.MM.YY followed by a comma. All of this can be achieved with one command (this operation can be vectorized over the entire column in the data frame); replace the YYYY-MM-DD date with the date of your measurements:
stringr::str_replace(as.character(as.POSIXct(1661611923019071/1000000, origin = '1970-01-01', tz = 'Europe/Berlin')), '2022-08-27', '27.08.22,')
The output in Watts should be averaged per second. The same data above is shown below after processing with R; note the 7 values above are averaged per second, resulting in two rows.
To save the CSV file with a semi-colon separator, the first column with row names starting at the number 1, and no string delimiter, use the following R command:
write.csv2(<EstructuraDeDatos>, file = <Ruta/a/archivo.csv>, row.names = TRUE, quote = FALSE)
El resultado debería parecerse al siguiente:
| ; | Zeit ; | Wert 1-avg[W] |
|---|---|---|
| 1 ; | 27.08.22, 16:52:03 ; | 43.00000 |
| 2 ; | 27.08.22, 16:52:04 ; | 28.20000 |
Datos de rendimiento (en bruto)
When using Collectl for hardware performance data, it is necessary to do the following before uploading the data to OSCAR.3
- Remove all information above the header row.
- Remove all # characters from the file.
- In the first column, no separator value should come between the data-time (otherwise, the date and time will be interpreted as two separate columns).
- The date should also have a character inserted between YYYYMMDD, e.g., MM.DD.YYYY as above. Whatever character is used must be specified in
OSCAR. - Column names can be anything you want as they will be specified within
OSCAR. - El archivo se debe guardar en formato CSV.
Moreover, the hardware performance output from Collectl includes many columns that are not necessary for analysis. The only measurements that need to be specified are the following columns:
- [CPU]Totl = Procesador
- [MEM]Used = Memoria principal (kilobytes usados)
- [NET]RxKBTot = Red (kilobytes recibidos/s)
- [NET]TxKBTot = Red (kilobytes transmitidos/s)
- [DSK]ReadKBTot = Disco (kilobytes leídos/s)
- [DSK]WriteKBTot = Disco (kilobytes escritos/s)
Below is an example of the preprocessed results from Collectl measuring the performance data for Kate. The timestamp increases in one-second increments.
| Date-Time ; | cpu ; | mem ; | net_rec ; | net_trn ; | dsc_rd ; | dsc_wr |
|---|---|---|---|---|---|---|
| 27.08.2022 16:47:10 ; | 1 ; | 7131968 ; | 0 ; | 0 ; | 0 ; | 0 |
| 27.08.2022 16:47:11 ; | 4 ; | 7131968 ; | 0 ; | 0 ; | 0 ; | 0 |
| 27.08.2022 16:47:12 ; | 1 ; | 7131968 ; | 0 ; | 0 ; | 0 ; | 0 |
| 27.08.2022 16:47:13 ; | 1 ; | 7131968 ; | 0 ; | 0 ; | 0 ; | 120 |
| 27.08.2022 16:47:14 ; | 1 ; | 7131968 ; | 0 ; | 0 ; | 0 ; | 0 |
| 27.08.2022 16:47:15 ; | 1 ; | 7131968 ; | 0 ; | 0 ; | 0 ; | 56 |
| 27.08.2022 16:47:16 ; | 1 ; | 7131968 ; | 0 ; | 0 ; | 0 ; | 48 |
| 27.08.2022 16:47:17 ; | 1 ; | 7131968 ; | 0 ; | 0 ; | 0 ; | 0 |
| 27.08.2022 16:47:18 ; | 1 ; | 7131968 ; | 0 ; | 0 ; | 0 ; | 0 |
| 27.08.2022 16:47:19 ; | 4 ; | 7131968 ; | 0 ; | 0 ; | 0 ; | 132 |
Envío de los datos
Once the above CSV files are ready, you can run the analysis using OSCAR, which will generate a summary report you can use either for eco-certification or for your own data-driven purposes. In the OSCAR interface, note the following:
- The interface language is currently German only; see below for translations.
- The duration of the measurements in seconds must be specified.
- Se usa el punto y coma como separador.
- The correct formatting of the time stamp must be specified for each of the uploaded files, e.g.,
%Y-%m-%d %H:%M:%OS.
Paso 1: Obtener los datos de la medición
The landing page of the website (below) states that the first step is obtaining measurement data (German: Erfassung Messdaten). If you are at this point in the process, you should have already measured your software and prepared the CSV files.

All examples here are based on the Okular data in this ZIP file.
Paso 2: Enviar los datos de la medición
Once you have the CSV files for the baseline, idle mode, and standard usage scenario measurements ready, click on (2) Upload Messdaten > Upload.
The measurement data (German: Messdaten) include the log file of actions (German: Aktionen), energy consumption (German: Elektrische Leistung), and hardware performance data (German: Hardware-Auslastung).
Under Messungen, upload either the idle mode or standard usage scenario measurement data.
For Art der Messung (‘Type of Measurement’) in the lower right of the UX, select Leerlauf (‘Idle Mode’) or Nutzungsszenario (‘Usage Scenario’) depending on which report you wish to generate.
Under Baselines upload the baseline measurement data.
Indicate the duration of the measurement scenarios in seconds (German: Dauer der Einzelmessungen (s)).
Note that the baseline measurements are always uploaded along with either the idle mode or standard usage scenario measurements.
See below for what a completed upload for the Nutzungsszenario looks like.

Timestamps Once the data has been uploaded, you will need to tell OSCAR how to read the data.
Let’s start with the timestamp format (German: Formatierung Zeitstempel). This is one aspect of the process which can cause problems if not done correctly. This is done under (2) Upload Messdaten > Formatierung Zeitstempel.
Consider the Okular data:
For the log file of actions, the datetime is encoded as YYYY-MM-DD HH:MM:SS (e.g., "2022-10-04 12:32:43.656" in “okularActions.csv”).
In
OSCAR, this is specified as "%Y-%m-%d %H:%M:%OS" (see screenshot below). OSCAR will take care of the fractional seconds.For the energy consumption data, the datetime is encoded as DD.MM.YY, HH:MM:SS (e.g., "04.10.22, 12:32:43" in “okular_baseline_eletrLeistung.csv”). Note the period in the date and the comma seperating date from time, as well as only having two digits for the year.
In
OSCARthis is specified as "%d.%m.%y, %H:%M:%OS" (see screenshot below), in which the lowercase “%y” indicates a year with two digits.For the hardware performance data, the datetime is encoded as DD.MM.YYYY HH:MM:SS (e.g., "04.10.2022 12:31:43" in “baseline_hardware_formatiert.csv”). Note the period in the date and the four-digit year.
In
OSCAR, this is specified as: "%d.%m.%Y %H:%M:%OS" (see screenshot below), in which the uppercase “%Y” indicates a year with four digits.

Measurement Data After the timestamps have been correctly specified, let’s explore the format of the measurement data (German: Formatierung Messdaten) in OSCAR.
First, take a look at the log file of actions (German: Aktionen). This is done under (2) Upload Messdaten > Formatierung Messdaten > Aktionen.
Here you need to indicate for the uploaded CSV file the separator (German: Trennzeichen), the string delimiter (German: Textqualifizierer), and the decimal separator (German: Dezimaltrennzeichen).
For the Okular data, this is defined as a semi-colon separator, double quotation string delimiter, and a period or full-stop decimal separator (see screenshot below).
Adicionalmente, habrá que indicar lo siguiente:
- si la primera línea contiene las cabeceras (en alemán, Erste Zeile enthält Überschriften);
- el número de líneas que se deben saltar (en alemán, Anzahl zu überspringender Zeilen); y
- la codificación de caracteres (en alemán, Zeichensatz (Encoding)).
Para los datos de Okular, se ha definido como se ve en la siguiente captura de pantalla: «la primera línea contiene las cabeceras» está sin marcar, se omiten 0 líneas y la codificación de caracteres es utf-8.
Una vez que todo se haya definido de forma correcta, se mostrará una vista previa de la hoja de cálculo.

Segundo, echa un vistazo a las medidas de consumo de energía (en alemán, Elektrische Leistung). Esto se hace en (2) Upload Messdaten > Formatierung Messdaten > Elektrische Leistung.
La entrada necesaria es la misma que para el archivo de registro de acciones, como se ve en la siguiente captura de pantalla.
Para los datos de Okular de aquí, se usa un punto y coma como separador, comillas dobles como delimitador de cadenas y la codificación de caracteres utf-8. No obstante, ahora se ha indicado que se usa la coma como separador decimal y la marca indica que la primera línea contiene las cabeceras. Para terminar, se ha omitido la primera línea.
Una vez que todo se haya definido de forma correcta, se mostrará una vista previa de la hoja de cálculo.

Finalmente, echa un vistazo a los datos de rendimiento del hardware (en alemán, Hardware-Auslastung). Esto se hace en (2) Upload Messdaten > Formatierung Messdaten > Hardware-Auslastung.
El formato de entrada requerido es el mismo. La entrada de este ejemplo usa un punto y coma como se parador, comillas dobles como delimitador de cadenas y un punto como separador decimal. Hay una marca que indica que la primera línea contiene las cabeceras, se saltan 0 líneas y la codificación de caracteres es utf-8.
No obstante, ahora existe el requisito adicional de especificación de columnas (en alemán, Spalten).
Para la especificación de las columnas, se debe identificar lo siguiente; selecciona «NA» para las columnas que no se usen, como «Auslastung Auslagerungsdatei» aquí.
- Zeitstempel: Fecha y hora (es decir, ‘Date-Time’)
- CPU-Auslastung: CPU (es decir, ‘X.CPU.Totl’)
- RAM-Auslastung: RAM (es decir, ‘X.MEM.Used’)
- Über Netzwerk gesendet: Transmitido a la red (es decir, ‘X.NET.TxKBTot’)
- Über Netzwerk empfangen: Recibido de la red (es decir, ‘X.NET.RxKBTot’)
- Von Festplatte gelesen: Leído del disco (es decir, ‘X.DSK.ReadKBTot’)
- Auf Festplatte geschrieben: Escrito en el disco (es decir, ‘X.DSK.WriteKBTot’)
- Auslastung Auslagerungsdatei: Intercambio (aquí, ‘N/A’)

Traducciones
A continuación se muestra un resumen de parte de la terminología en alemán que se usa en OSCAR y su traducción al español:
- Messungen: Mediciones (por ejemplo, Modo inactivo o SUS)
- Aktionen: Acciones (es decir, archivo de registro de las acciones realizadas)
- Elektrische Leistung: ‘Energía eléctrica’ (es decir, las medidas de consumo de energía)
- Hardware-Auslastung: ‘Carga del hardware’ (es decir, las medidas del rendimiento del hardware)
- Dauer der Einzelmessungen (s): ‘Duración de las mediciones individuales (s)’ (es decir, la duración de cada iteración en segundos)
- Art der Messung: ‘Tipo de medición’
- Leerlauf: ‘Inactividad’ (es decir, modo inactivo)
- Nutzungsszenario: ‘Escenario de uso’ (es decir, SUS)
- Formatierung Messdaten: ‘Formato de los datos de medición’
- Formatierung Zeitstempel: ‘Formato de las marcas de tiempo’
- Trennzeichen ‘Separador’
- Textqualifizierer: ‘Delimitador de cadenas’
- Dezimaltrennzeichen: ‘Separador decimal’
- Erste Zeile enthält Überschriften: ‘La primera línea contiene las cabeceras’
- Anzahl zu überspringender Zeilen: ‘Número de líneas a omitir’
- Zeichensatz (Encoding): ‘Conjunto de caracteres (codificación)’
- Spalten: Columnas
- Zeitstempel: ‘Fecha y hora’
- CPU-Auslastung: ‘Uso de la CPU’
- RAM-Auslastung: Uso de memoria’
- Über Netzwerk gesendet: ‘Enviado a la red’
- Über Netzwerk empfangen: ‘Recibido de la red’
- Von Festplatte gelesen: ‘Leído del disco’
- Auf Festplatte geschrieben: ‘Escrito en el disco’
- Auslastung Auslagerungsdatei: ‘Uso del archivo de intercambio’
Paso 3: Generación de los informes (Inactivo, SUS)
After completing the above, the report can be generated and downloaded. You will need to do this process twice, once for (i) the idle mode and (ii) standard usage scenario measurements, resulting in two documents.

For Blue Angel eco-certification, the two reports will be submitted for evaluation by RAL.
Para ejemplos de lo anterior para Okular, consulta el repositorio de Solicitud de Blue Angel:
Preparación de la documentación para Blue Angel
Para la ecocertificación Blue Angel es necesario rellenar varios formularios además de los dos informes de OSCAR.
La información que se debe incluir en los formularios es la siguiente:
- Detalles sobre el software (nombre, versión) y el proceso de medición (cuándo y dónde se realizaron las mediciones, etc.).
- Detalles técnicos sobre el medidor de consumo (instrumento, frecuencia de muestreo, tamaño del escenario, tamaño de la muestra).
- Detalles técnicos sobre el sistema de referencia (año, modelo, procesador, núcleos, etc.).
- Pila de software usada para las mediciones (
xdotool,Collectl, etc.). - Requisitos mínimos del sistema (procesador, arquitectura, memoria de trabajo local, etc.).
- Resultados de consumo de energía que se encuentran en los informes
OSCARo equivalentes. - Resultados del uso de hardware, que incluye lo siguiente (para IDLE se deben usar las mediciones del modo inactivo, y para SUS se deben usar las mediciones del escenario de uso estándar):
Full Load: “For processing power, the full load is 100%, for working memory the sum of the installed RAM capacities, for network bandwidth the maximum transmission speed, etc.” (Blue Angel award criteria: p. 23).
Base Load: Average load for the reference system in Baseline measurements.
Idle/SUS Load: Average load for the reference system for IDLE/SUS measurements.
From the above measurements, the following calculations are made for hardware utilization (for IDLE use the idle mode measurements, and for SUS use the standard usage scenario measurements):
- Net Load: IDLE/SUS Load - Base Load
- Allocation Factor: Net Load/(Full Load - Base Load)
- Effective Load: Net Load + Allocation Factor * Base Load
- Hardware Utilization (SUS only): Effective Load * Time (seconds)
For Blue Angel eco-certification, the above information will be added to two documents called “Annex 1” and “Annex 2”.
Para ejemplos de lo anterior para Okular, consulta el repositorio de Solicitud de Blue Angel:
Alternativa: Configuración de Gosund SP111
Want to get started with the process of measuring your software, but short on cash or gear? Want to give the process a try without setting up a dedicated lab? Try this hack converting an inexpensive power plug to a power meter, courtesy of Volker Krause, who also documented the process provided here. You can read more at the following posts from Volker’s blog:
- “Cheap Electric Power Measurement”
- [«KDE Eco Sprint de julio de 2022»](https://web.archive.org/web/20220819231538/https://www.volkerkrause.eu/2022/07/23/kde-eco- sprint-july-2022.html)
Below is a guide to setting up a Gosund SP111 power plug already flashed with Tasmota firmware in 10 steps.
Although the data from the inexpensive power meter will likely not be accepted by the Blue Angel for eco-certification, it is nonetheless possible to obtain preliminary data using this tool.
(0) Prerrequisito
Es necesario que la toma de alimentación tenga instalada una versión de Tasmota lo suficientemente reciente.
(1) Reinicio del firmware
Si el dispositivo se había conectado previamente a otra red wifi, es posible que necesite un reinicio completo antes de poder conectarse a una nueva.
Si el dispositivo había abierto con anterioridad un punto de acceso wifi llamado «tasmota-XXXXX», esto no es necesario; continúa directamente con (2).
Pulsa el botón durante 40 segundos.
El dispositivo se reiniciará y podrás continuar con (2).
(2) Configuración wifi
El dispositivo abre un punto de acceso wifi llamado «tasmota-XXXXX». Conéctate a él.
Abre http://192.168.4.1 en un navegador.
The device will ask you for the WiFi name and password to connect to after entering those. The device will reconnect to that WiFi and disable its access point.
While doing that it should show you its new address in the browser—make a note of it.
In case that did not happen, check your WiFi router for the address of the device.
(3) Configuración de Tasmota
Abre la dirección del paso (2) en un navegador.
You should see the Tasmota web UI (a big “ON/OFF” text and a bunch of blue and one red button).
Pulsa «Configuración».
Pulsa «Configurar otro».
Copiar
     {"NAME":"Gosund SP111 2","GPIO":
     [56,0,57,0,132,134,0,0,131,17,0,21,0],"FLAG":0,
     "BASE":18}
en el campo de entrada de la plantilla.
Marca la casilla «Activar».
Pulsar «Guardar».
El dispositivo se reiniciará. Vuelve a conectarte.
The UI should now also contain text fields showing electrical properties, and the “Toggle” button should now actually work.
(4) Calibración
Abre la dirección del paso (2) en un navegador.
Connect a purely resistive load with a known wattage, such as a conventional light bulb (not a LED or energy-saving bulb).
Switch on power by clicking “Toggle” if needed.
Verify that the “Power Factor” value is shown as 1 (or very close to 1); if it is lower, the current load is not suited for calibration.
Pulsa «Consola».
Enter the following commands one at a time and press enter:
   AmpRes 3
   VoltRes 3
   EnergyRes 3
   WattRes 3
   FreqRes 3
   SetOption21 1
   VoltageSet 230
Enter the command PowerSet XXX with XXX replaced by the wattage specified for the test load (e.g., “40” for a 40W light bulb).
Pulsa «Menú principal».
The main page now should show correct power readings with several decimals precision.
(5) MQTT Broker Setup
At present, the only known way to achieve high-frequency automatic readouts is by polling over MQTT. This is not ideal and needs additional setup, unfortunately.
If you happen to have a MQTT Broker around already, skip to step (6); otherwise, you need to set one up. The below scenario assumes Mosquitto is packaged for your GNU/Linux distribution (and therefore does not configure any security), so only do this in your own trusted network and switch it off when not needed.
instala el paquete
mosquittoañade un archivo
/etc/mosquitto/conf.d/listen.confcon el siguiente contenido:listener 1883 allow_anonymous trueinicia Mosquitto usando
systemctl start mosquitto.service
(6) Configuración de MQTT Tasmota
Conéctate al dispositivo Tasmota usando un navegador web y abre la página de configuración de MQTT usando «Configuración > Configurar MQTT».
Enter the IP address of the MQTT broker into the “Host” field.
Note down the value shown right of the “Topic” label in parentheses (typically something like “tasmota_xxxxxx”). This will be needed later on to address the device via MQTT. You can also change the default value to something easier to remember, but this has to be unique if you have multiple devices.
Pulsar «Guardar».
The device will restart and once it is back you should see output in its Console prefixed with “MQT”.
(7) Verificación de la comunicación con MQTT
Aquí se supone que ya se han instalado las herramientas cliente de Mosquitto, que suelen estar disponibles como paquetes de la distribución.
Hacen falta dos terminales para verificar que la comunicación con MQTT funciona como es de esperar.
- En el terminal 1, ejecuta
mosquitto_sub -t 'stat/<asunto>/STATUS10' - En el terminal 2, ejecuta
mosquitto_pub -t 'cmnd/<asunto>/STATUS' -m '10'
Sustituye
<asunto>con el valor anotado en el paso (6).Cada vez que ejecutes la segunda orden, deberías ver un conjunto de valores impresos en el primer terminal.
- En el terminal 1, ejecuta
(8) Continuous Power Measurements
Consulta estos guiones.
(9) Cambio de redes wifi
For security reasons, once connected to a WiFi network, Tasmota will not let you get back to step (2) by default without hard resetting the device (40-second button press). However, a hard reset also removes all settings and the calibration. If you need to move to a different network, there are less drastic options available, but these changes can only be made inside the network you originally connected to:
Under Configuration > Configure WiFi, you can add details for a second WiFi access point. Those will be tried alternatingly with the first configuration by default. This does not compromise security, but requires you to know the details for the network you want to connect to.
You can configure Tasmota to open an access point as in step (2) by default for a minute or so after boot, and then try to connect to the known configurations. This makes booting slower in known networks, and opens the potential for hijacking the device, but it can be convenient when switching to unknown networks. This mode can be enabled in the Console by the command
WifiConfig 2, and disabled by the commandWifiConfig 4.For Tasmota version 11 the 40-second button press reset can leave the device in a non-booting state, whereas resetting from the Console using
Reset 1doesn’t have that problem, but has to be done before disconnecting from the known WiFi as well.(10) Recuperación de dispositivos no arrancables
First and foremost: DO NOT CONNECT THE DEVICE TO MAIN POWER! That would be life-threatening. The entire flashing process is solely powered from 3.3V supplied by the serial adapter. Do not do any of this without having read this getting started guide.
With Tasmota 11, you can end up in a non-booting state by merely resetting the device using the 40-second button press. This does not permanently damage the device, and it can be fixed with reflashing via a serial adapter.
The basic process is described in the above guide. The PCB layout of the Gosund SP 111 can be seen here.
In order for this to work, you need to connect GPIO0 (second pin on bottom left in the above image) to GND before powering up (i.e., before connecting with USB). The device LEDs (red and blue) are a useful indicator of whether you ended up in the right boot mode: the red LED should be on, and not flashing quickly, and the blue and red LED should not be on together. Once in that state, the connection can be removed (e.g., if you just hold a jumper cable to the pin) and it will remain in the right mode until a reboot.
Again: DO NOT CONNECT THE DEVICE TO MAIN POWER as this is life-threatening.
(B) Vida útil del hardware
The criteria in category (B) ensure that the software has low-enough performance requirements to run on older, less powerful hardware at least five years old.
Many FOSS applications run on hardware much older than 5 years. In fact, members of the KDE community have noted that KDE’s desktop environment Plasma runs on hardware from even 2005!
This category is relatively easily to fulfill for the Blue Angel application. Compliance entails a declaration of backward compatibility, including details about the hardware on which the software runs and the required software stack. To demonstrate compliance, document the following information in two documents called “Annex 1” and “Annex 2”:
- Año del sistema de referencia (por ejemplo, 2015)
- Modelo (por ejemplo, Fujitsu Esprimo 920)
- Procesador (por ejemplo, Intel Core i5-4570)
- Núcleos (por ejemplo, 4)
- Velocidad del reloj (por ejemplo, 3,6 GHz)
- RAM (por ejemplo, 4 GB)
- Disco duro (SSD/HDD) (por ejemplo, 500 GB)
- Tarjeta gráfica (por ejemplo, Intel Ivybridge Desktop)
- Red (por ejemplo, Realtek Ethernet)
- Caché (por ejemplo, 6144 KB)
- Placa base (por ejemplo, Fujitsu D3171-A1)
- Sistema operativo (por ejemplo, Ubuntu 18.04)
De nuevo, los ejemplos para Okular se pueden encontrar en los enlaces siguientes:
(C) Autonomía del usuario
As discussed in PART II, the Blue Angel user autonomy criteria cover eight general areas:
- Formatos de los datos
- Transparencia
- Continuidad del soporte
- Desinstalabilidad
- Capacidad sin conexión
- Modularidad
- Libertad frente a la publicidad
- Documentación
Many FOSS projects may take for granted that Free Software respects user autonomy and in some cases information from the above list is missing from websites, manuals, wikis, etc. This may include documentation about support for open standards, uninstallability, continuity of support, and so on.
Documenting this information is important, both for fulfilling the Blue Angel award criteria and for giving users information about long-term sustainable use of their software and hardware.
This is not an exhaustive presentation for each of the above categories of the Blue Angel criteria. Rather, this guide focuses on aspects of the criteria which KDE/FOSS projects can easily document and provide (which is already most of the work). For the full criteria, see Section 3.1.3 in the basic award criteria.
2.1 Formatos de los datos
The main information to include in documentation:
- Which (open) data formats are supported—with links to specifications, e.g., PDF?
- Also of interest: Are there examples of other software products that process these data formats?
For an example of the online documentation of supported data formats for Okular, visit the Okular website.
An example of documentation for the Blue Angel can be found in Annex 4.
2.2 Transparencia del producto de software
When missing, provide links to documentation of the API, source code, and software license. For example, for KMail:
An example of documentation for the Blue Angel can be found in Annex 5.
2.3 Continuidad del soporte
Details about continuity of support to document include:
- Information about how long the software has been supported for (with links to release announcements).
- Release schedule and details (e.g., who maintains the software).
- Statement that updates are free of charge.
- Declaration on how the free and open source software license enables continuous support indefinitely.
- Information about whether and how functional and security updates may be installed separately.
An example of Okular’s continuity of support documentation for the Blue Angel can be found in Section 3.1.3.3 of Annex 6.
2.4 Desinstalabilidad
How are users able to completely uninstall the software? Relevant details might include:
- Uninstallation instructions that depend on how the software was installed (source code or binary).
- Examples of uninstallation instructions (source code or package managers, with relevant links to documentation).
- Information about whether user-generated data is also removed when uninstalling a program.
An example of Okular’s uninstallability documentation for the Blue Angel can be found in Section 3.1.3.4 of Annex 6.
2.5 Capacidad sin conexión
Does the software require external connections such as a license server in order to run? If not, and no network connection is needed as the software can be used offline, this should be documented.
An example of Okular’s offline capability documentation for the Blue Angel can be found in Section 3.1.3.5 of Annex 6.
2.6 Modularidad
La información que se debe documentar incluye:
- ¿Qué funciones del software son modulares y pueden desactivarse durante la instalación?
- ¿Se pueden instalar los manuales del software o las traducciones por separado?
- ¿Se incluyen en la instalación módulos que no estén relacionados con la funcionalidad principal, como módulos de seguimiento o de integración en la nube? Si no es así, ¡documéntalo!
Un ejemplo de la documentación de modularidad de Okular para Blue Angel se puede encontrar en la Sección 3.1.3.6 del Anejo 6.
2.7 Libertad frente a la publicidad
If the software does not display advertising, make this explicit in manuals and wikis and declare it in the Blue Angel application document.
2.8 Documentación
Esto incluye lo siguiente:
- General process for installing/uninstalling the software? This may include generic instructions or tutorials for a specific desktop environment or package manager.
- Data import/export process?
- What can users do to reduce the use of resources (e.g., configuration options for improving performance)?
- Does the software have any resource-intensive functionality not necessary for the core functionality? If not, great. Let’s tell the users!
- Licensing terms related to further development of the software products, with links to source code and license?
- Who supports the development of the software?
- Does the software collect any personal data? Is is compliant with existing data protection laws? If yes, document it!
- What is the privacy policy? Is there telemetry? If yes, how does the software handle data security, data collection, and data transmission? Also, are there ads or tracking embedded in the software? If not, excellent—now make sure to spread the word!
An example of Okular’s product documentation for Blue Angel certification can be found in Section 3.1.3.8 of Annex 6.
Envío de la solicitud a RAL
Para los ejemplos de toda la documentación anterior, consulta el repositorio de Solicitudes para Blue Angel de KDE.
Una vez que tengas toda la documentación preparada, deberás enviarla para su revisión a RAL gGmbH (como recordarás, RAL es el organismo autorizado que evalúa el cumplimiento de los criterios del galardón). El portal para presentar solicitudes al galardón Blue Angel se encuentra aquí (https://portal.ral-umwelt.de/).
Si necesitas ayuda con la interfaz en línea, RAL proporciona documentación.
Ejemplo de documentos del envío de la solicitud
A continuación se muestran ejemplos de la documentación Blue Angel para Okular.
- Anexo 1: Formulario
- Anexo 2: Hoja de cálculo
- Anexo 3: Informe OSCAR para el modo inactivo
- Anexo 3: Informe OSCAR para SUS
- Anexo 4: Formatos de los datos
- Anexo 5: Estándares abiertos
- Anexo 6: Información del producto
- Anexo 7: Formato de datos para transmitir la información del producto sobre eficiencia energética y de recursos
Iniciativas notables de software sostenible
Existen numerosas iniciativas que trabajan en herramientas para medir el consumo energético del software. Nos gustaría mencionar cinco en particular que han colaborado con la iniciativa KDE Eco:
El grupo de trabajo Green Software Engineering en el Environmental Campus Birkenfeld (en alemán, Umwelt Campus Birkenfeld)
Desde 2008, el grupo de trabajo Green Software Engineering ha estado trabajando en proyectos de investigación centrados en el software sostenible. Su investigación constituye la base del trabajo que aquí se presenta, y su equipo ha desarrollado herramientas como
OSCARy ha evaluado diversas aplicaciones de KDE, incluida Okular.El Öko-Institut es una de las principales organizaciones independientes de investigación y consultoría de Europa que trabaja por un futuro sostenible. El grupo de investigación Productos Sostenibles y Flujos de Materiales trabaja en diversas metodologías de medición. En esta publicación de blog (en alemán), los investigadores presentan una técnica de automedición que utiliza un sencillo script de Python.
Green Coding Berlin se centra en la investigación del consumo energético del software y su infraestructura, la creación de herramientas de medición de código abierto y la construcción de una comunidad y un ecosistema en torno al software ecológico.
El proyecto SoftAWERE de la Sustainable Digital Infrastructure Alliance
El grupo directivo de SoftAWERE supervisa y marca la dirección para el desarrollo de herramientas y etiquetas para aplicaciones de software energéticamente eficientes.
La Green Web Foundation realiza un seguimiento y acelera la transición hacia una internet libre de combustibles fósiles.
Acerca de
Autores
KDE Eco tooling and documentation are provided by community members who have volunteered to contribute to this project for the benefit of all. Primary contributors include (listed in alphabetical order by first name): Arne Tarara, Cornelius Schumacher, Emmanuel Charruau, Karanjot Singh, Nicolas Fella, and Volker Krause. Thank you—your contributions make this handbook possible.
The text of this version of the handbook was written and/or compiled from the above documentation by Joseph P. De Veaugh-Geiss. Olea Morris edited the text. Lana Lutz and Arwin Neil Baichoo made the book and website design as well as the images therein beautiful. Paul Brown made significant improvements to the Okular blog post adapted for “Okular, The First Eco-Certified Computer Program” in Part II. Wikipedia was a source for several texts which were included here in modified form. Thank you to the community of Wikipedia writers and editors for making such a wonderful resource for all of us. See the end of each section for additional information about sources.
Agradecimientos
Thank you to the many contributors to the KDE Eco initiative in general (listed in alphabetical order by first name): Achim Guldner, Adriaan de Groot, Aleix Pol, Alexander Semke, André Pönitz, Björn Balazs, Carl Schwan, Chris Adams, Christopher Stumpf, David Hurka, Fabian, Felix Behrens, Franziska Mai, Harald Sitter, Jens Gröger, Johnny Jazeix, Jonathan Esk-Riddell, Kira Obergöker, Lydia Pintscher, Marina Köhn, Mathias Bornschein, Max Schulze, Phu Nguyen, Sami Shalayel, Stefan Naumann, Sven Köhler, and Tobias Fella. Your contributions are greatly appreciated.
Quienes estén interesados en colaborar con KDE Eco pueden unirse a la lista de correo o a la sala Matrix. También se invita a los colaboradores a participar en uno de los esprints de KDE Eco y en reuniones presenciales o en línea. Para más información, visita nuestro sitio web.
The KDE Eco initiative has benefited from many informative discussions that took place at the following conferences and workshops: Akademy 2022, Linux App Summit 2022, FOSDEM 2023, rC3: NOWHERE 2021, SFSCon 2021/2022, Grazer Linuxtage 2022, Qt World Summit 2022, QtDevCon 2022, Fedora Nest 2022, Green Coding Berlin meetups, Sustainable Digital Infrastructure Alliance hackathon, EnviroInfo 2022, and Bits & Bäume 2022. Thank you!
Licencia
Salvo que se indique lo contrario, todo el contenido se publica bajo la licencia Creative Commons Attribution-ShareAlike 4.0 International (CC-BY-SA-4.0). Para más información sobre las licencias de documentación de KDE, consulta la política de licencias de KDE.
Aviso de financiación
El proyecto Blauer Engel Für FPSS fue financiado por la Agencia Federal de Medio Ambiente (UBA) y el Ministerio Federal de Medio Ambiente, Protección de la Naturaleza, Seguridad Nuclear y Protección al Consumidor (BMUV) alemanes. Los fondos se ponen a disposición mediante una resolución del Bundestag alemán.


El editor es responsable del contenido de esta publicación.
In 2005, two years after the directive was transposed into European law, the Royal Society of Arts in the UK unveiled “WEEE Man”, designed by Paul Bonomini and fabricated by Stage One Creative Services. Originally located on London’s South Bank, the towering figure was subsequently moved to the Eden Project in Cornwall, where it currently resides. ↩︎
It is possible to have a setup using 3 computers, with the Standard Usage Scenario emulation generated on a computer independent of the SUT; see Kern et al. (2018). Details of such a setup with an external workload generator can be found at the FEEP repository. ↩︎
See Seiwert & Zaczyk 2021: p. 13 for details; see also Appendix A 2 on p. 46 for a Python script to automate some of these tasks. ↩︎