Measurement Lab Follow-Up: Sprint Achievements And To-dos
Note: This post was updated on Friday, 2 September 2022. See Section "Update: Problem Solving At Second Follow-Up Sprint (27 August)".
Overview
On Saturday 16 July 2022 KDE Eco held the second in-person Sprint to work on the community measurement lab at the KDAB office in Berlin. The Sprint is one of several planned follow-up events.
There were 9 participants in total: 6 of us in person and 3 virtual. The event attracted not only KDE community members (Volker, Nico, Tobias, Joseph, Alexander, Karanjot, Emmanuel), but also members of the Green Coding Berlin and the Green Web Foundation projects (Arne, Chris).
The goals of the event were two-fold: (i) to equip the lab with easy-to-use FOSS-based tooling; and (ii) to begin measuring KDE/Free Software. We made much progress in tooling, but alas, we have not been able to measure any software... yet.
Read on to learn why!
You can also read more about the Sprint at Volker's blog post.
Without the community the work of KDE Eco would not be possible. Thank you to everyone who could join us!
(left) Group photo of in-person attendees on that beautiful sunny Saturday afternoon; (right) we also had several virtual participants, including Alexander from LabPlot, who can be seen in the BigBlueButton room on the laptop screen. Although it would have been nice to use the big screen at the head of the table for the conference call, we were not able to get it to work. (Image: CC BY-NC-ND 4.0)
Reducing Carbon Emissions Of Computationally-Expensive Tasks
As with any event when many interesting and interested people are brought together, conversations quickly moved (slightly) off-topic. This Sprint was no exception. That said, although at times the discussions were digressive, they were always productive.
In fact, one such discussion early in the day resulted in concrete plans for action. The question was: Can KDE/Free Software reduce carbon intensity for updates and other power-hungry processes? In other words, can we program software to delay non-urgent tasks (such as updates) to times when the sources of the energy they would consume is greener and thus produce less CO2? This is an idea that has been floating around for a while and is being implemented by other update tools. To this end Chris, from the Green Web Foundation, presented the Golang Library tool grid-intensity-go, which exposes the carbon intensity from energy sources. Their GitHub repository describes the library as a "tool written in Go, designed to be integrated into Kubernetes, Nomad, and other schedulers, to help you factor carbon intensity into decisions about where and when to run jobs."
Can KDE and other Free Software projects run computationally-expensive jobs at times when renewable energy sources are most available? (Modified image from Award Ceremony: clean-IT Hackathon)
KDE Plasma uses the packager manager tool Discover for scheduling updates. Discover has an internal daemon that periodically checks for updates and downloads them. One idea is to have Discover call out to grid-intensity-go before starting a software update to check current energy sources and decide if the update should proceed. This would be relatively easily to implement for KDE alone, but it would be a much larger project to implement across GNU/Linux distributions. The KDE Eco initiatives FEEP and BE4FOSS aim to support all Free Software communities in integrating sustainability measures into their projects. Thus, plans are in the pipeline to apply for relevant funding to bring the larger community together to implement this across the update systems of interested distros. More information will be coming soon, so keep an eye on this space for updates!
Discover is Plasma's app store and package manager tool. It allows users to browse and install apps and to update their installation easily... and perhaps soon sustainably as well!
Working On Tooling To Measure Software And Visualize Results
Developing tooling for the lab and measuring software were in fact the main goals of the day.
Nico spent much of the day working on a script to read output from the GUDE Expert Power Control 1202 power meter using PySNMP, a SNMP library for Python, following previous work carried out by Umwelt Campus Birkenfeld.
Looking at the results sparked a lively conversation about what the data means, which Arne had previously looked into in direct discussions with GUDE support.
However, closer inspection of the results also revealed a serious issue: there is an unexpected delay in the measurement readout every 5 to 10 seconds. Note that the same problem arises with another Python script, which also uses the SNMP protocol for reading the output, albeit with a different implementation.
Since obtaining meaningful results will depend on having reliable output from the measurement tools, resolving this issue is of the highest priority for the next Sprint, tentatively planned for the end of August.
Working on the tools to read output from the GUDE power meter (left) and to visualize data in LabPlot (right). (Image: CC BY-NC-ND 4.0)
An important tool that KDE Eco is working to integrate into the lab is KDE's plotting software LabPlot. This tool provides easy-to-use, high-quality data visualizations -- and it is reportedly used by the scientific communities at NASA and CERN!
At the Sprint in May 2022, Volker had worked on using LabPlot with the inexpensive power meters community members have tested (namely, the Gosund SP111 power plug and the Microchip MCP39F511N), but with no success. Together with Alexander from LabPlot, who joined the Sprint via video conference in the afternoon, all of those issues are now resolved.
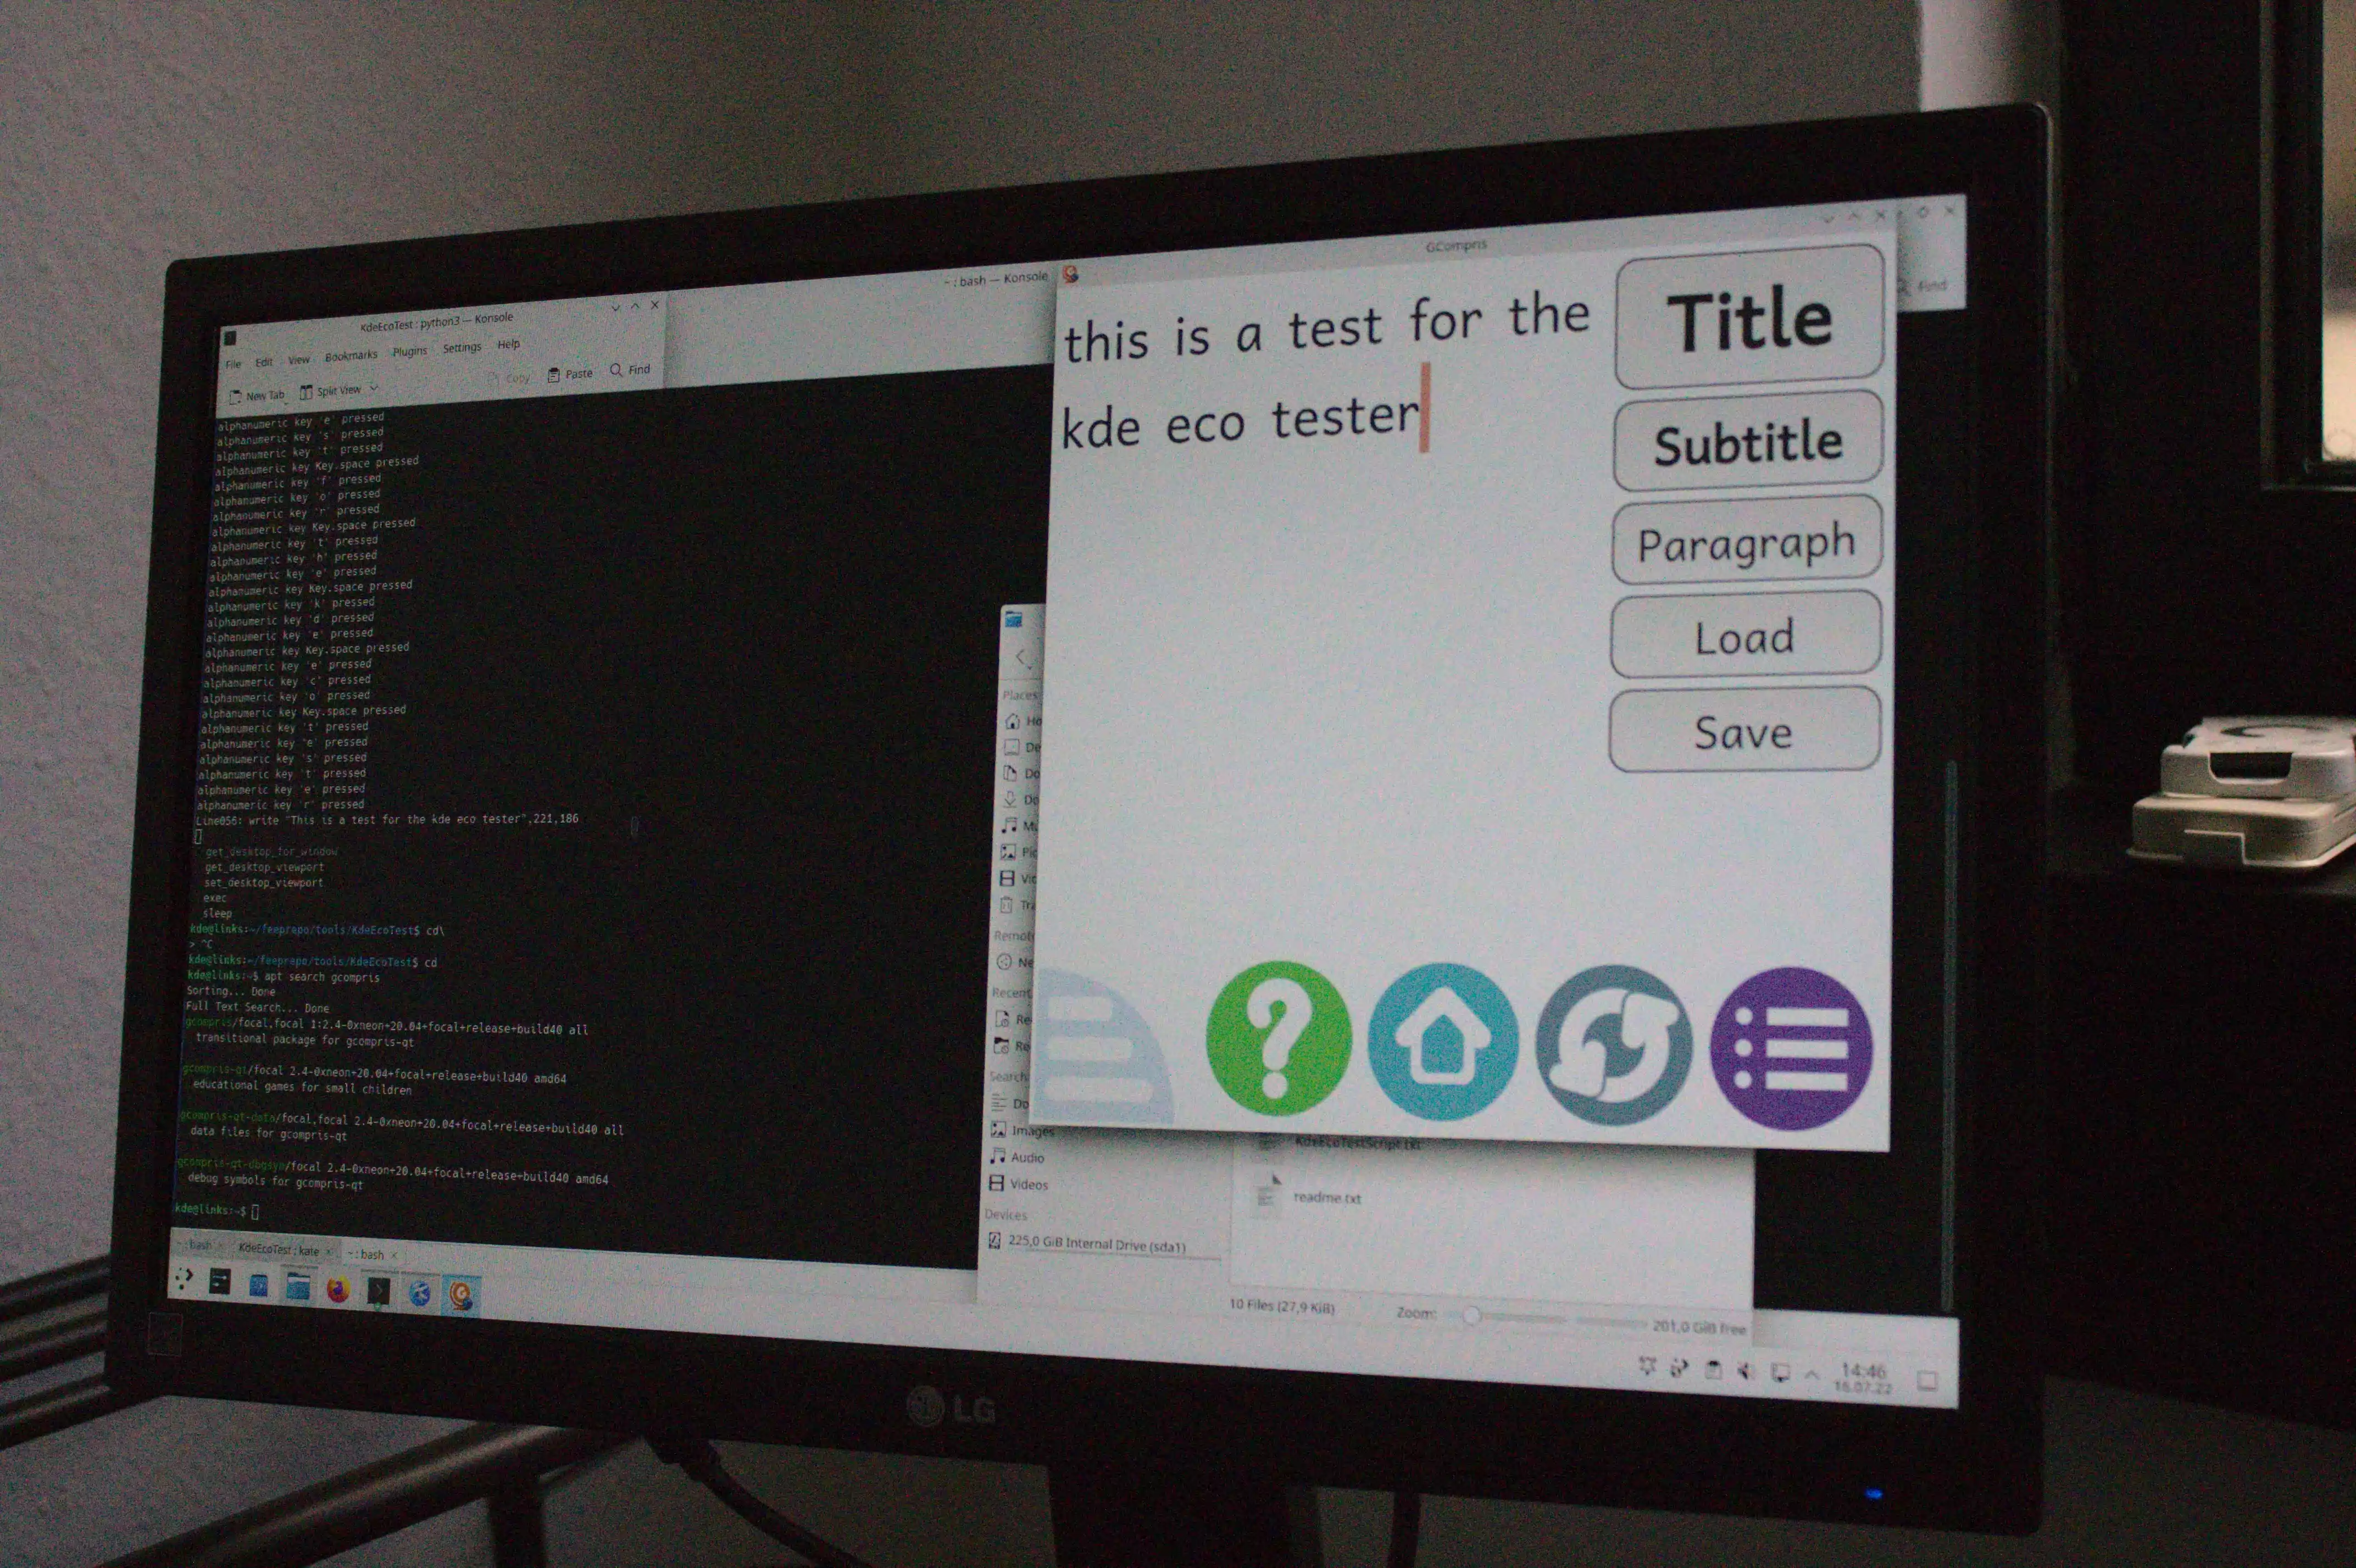
Emmanuel and Karanjot are working on KDE Test Creator / KDE Test to make usage scenario scripting easy and robust. The above is an image while testing the GCompris script. (Image: CC BY-NC-ND 4.0)
Usage Scenario Scripting
So we spent the day having productive discussions and working on tooling and debugging, but without reliable output from the power meter we were unable to measure any software, unfortunately.
However, we did make headway in the usage scenario scripts. These scripts emulate user behavior, and, over the past several months, Emmanuel has been working on the development of KDE Test Creator / KDE Test, which is written in Python and uses xdotool to trigger actions in the software being tested. A benefit of the KDE Test tools over others like Actiona is that the scripts are transferrable across different systems being tested, while also being easy enough to use to make scripting quick.
Although the tools are intended for testing software in the measurement lab, there are other possible uses for this or other emulation tools, including the creation of reproducible actions for bug reports or testing responsiveness on older hardware (see discussion here).
When testing the scripts, there were a couple of areas that needed improvement to make the log file output more usable. These included adding actions taken to the log file so researchers can easily identify what was done at what time stamp. Another issue was that the separator value was previously an empty space in the CSV file. This could cause problems when reading the file into data analysis programs. These issues were tackled by Karan with assistance from Emmanuel, both of whom joined the Sprint virtually. Now the log files are more verbose with a semi-colon separator. There were a couple of other minor bugs which showed up when testing the scripts, but these are now resolved as well.
Tobias also worked on usage scenario scripting for KDE's Matrix client NeoChat, a project which he actively contributes to. NeoChat is part of a distributed client-server system, so testing it requires setting up a Matrix server (Conduit, not federated for the lab setup). Although the objective is to test the client, not the server, setting up a server is necessary to have reproducible characteristics for measuring in the lab.
Tobias started scripting with KDE Test Creator, but after running into some problems (primarily related to scrolling), he switched to Rust and was able to emulate creating new users and rooms. We look forward to using the script to test NeoChat in the near future. Furthermore, perhaps we can eventually team up with the Umwelt Campus Birkenfeld project "ReFoPlan 2020 - Resource Efficient Software" to look at the energy consumption of both the client and the server. A goal of that project is to extend the Blue Angel award criteria to client-server systems and mobile apps.
To-dos
Although we took many steps forward, much remains to be done. The most urgent task is resolving the issue with the power meter readout. Once that is working, setting up the lab for remote access remains high on the list. Although it is always great to get together as a group, it will be even better once the tools the community is working on are accessible from anywhere in the world.
What is more, the BE4FOSS project will provide a handbook soon for how to set up measurement labs at a location near you!
There are many things we also hope to achieve with LabPlot, since presenting data is crucial to making their interpretation accessible, both to developers and to end users. One eventual goal is to have some averaging or smoothing to better be able to see what is happening in the output, since too many spikes or jittery lines can be hard to interpret. Alexander also prepared a video to demonstrate live plotting with RAPL-based energy measurements. Such visualizations could be part of a Plasma applet, for instance, to demonstrate how user behavior influences energy consumption in real time. Moreover, these awareness-raising tools might also one day incorporate carbon intensity information for a fuller view of how software contributes to CO2 emissions!
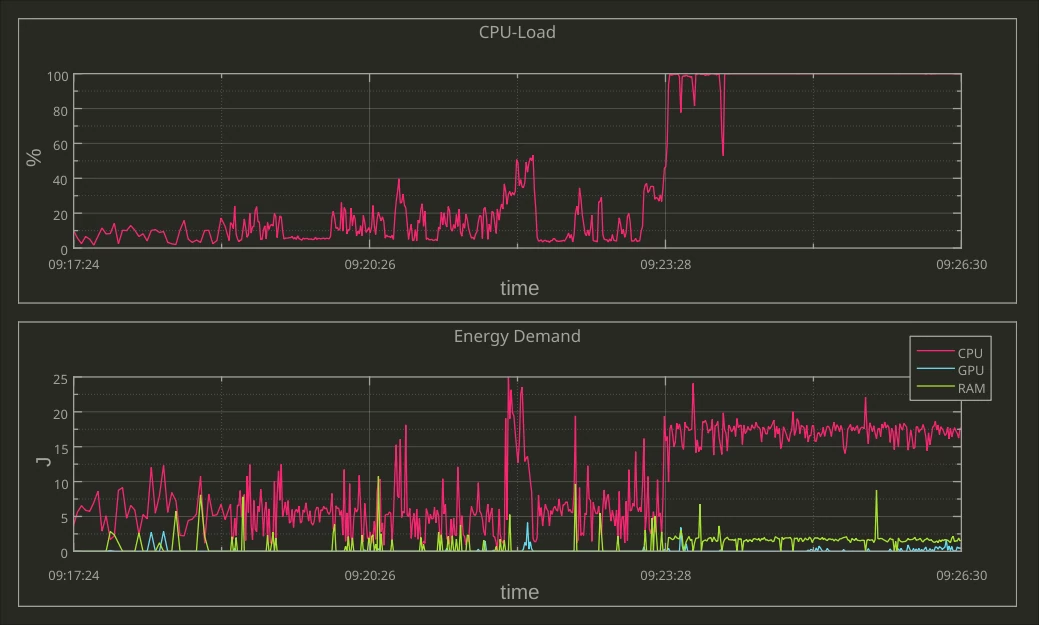
Monitoring user behavior in real time with LabPlot (Image: CC BY-NC-ND 4.0)
Update: Problem Solving At Second Follow-Up Sprint (27 August)
On Saturday 27 August a small group met at KDAB Berlin for a follow-up Sprint to tackle the readout issue with the power meter, as described above. In total we were 1 virtual and 4 in-person attendees (Arne, Volker, Nico, Björn, Joseph). As a result of the Sprint, I am happy to announce that the measurement lab now has a working Python script to read output from the GUDE power meter. You can download the script from the FEEP repository. A special thanks to the contribution of Arne from Green Coding Berlin (and you can read about their adventures in DC measurements at this blog post). So here we are: the lab should now be ready for the really exciting part of the project, measuring software! Keep an eye on this blog for updates.
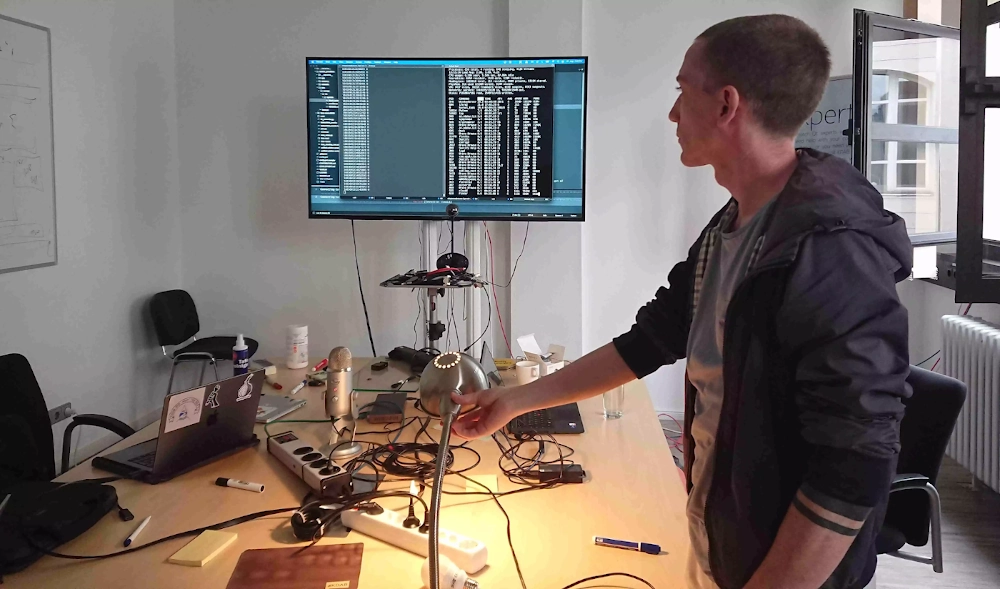
Arne testing the GUDE Python script by measuring the power consumption of the KDE Eco calibration lamp (Image: CC BY-NC-ND 4.0)
Volker also worked on updating the notes for the Gosund SP111 power plug, which included information about switching WiFi networks and recovering devices when they no longer boot, another problem that needed solving from the last Sprint. You can follow the guide yourself here. What is more, once you have the hacked power plug working, you can also download LabPlot and try out live plotting to see energy consumption in real time. To do this, redirect the power plug output to a CSV file (see instructions at Volker's blog). Then, in LabPlot import the CSV file by going to File > Add New > Live Data Source .... Where it says "Filter" select the Custom option, and under "Data Format" define the separator value used (e.g., comma, semi-colon, space). You can check that the output is correct under the "Preview" tab. If everything looks good, click OK. Now it is just a matter of right-clicking on the data frame window and selecting Plot Data > xy-Curve. Voilà!
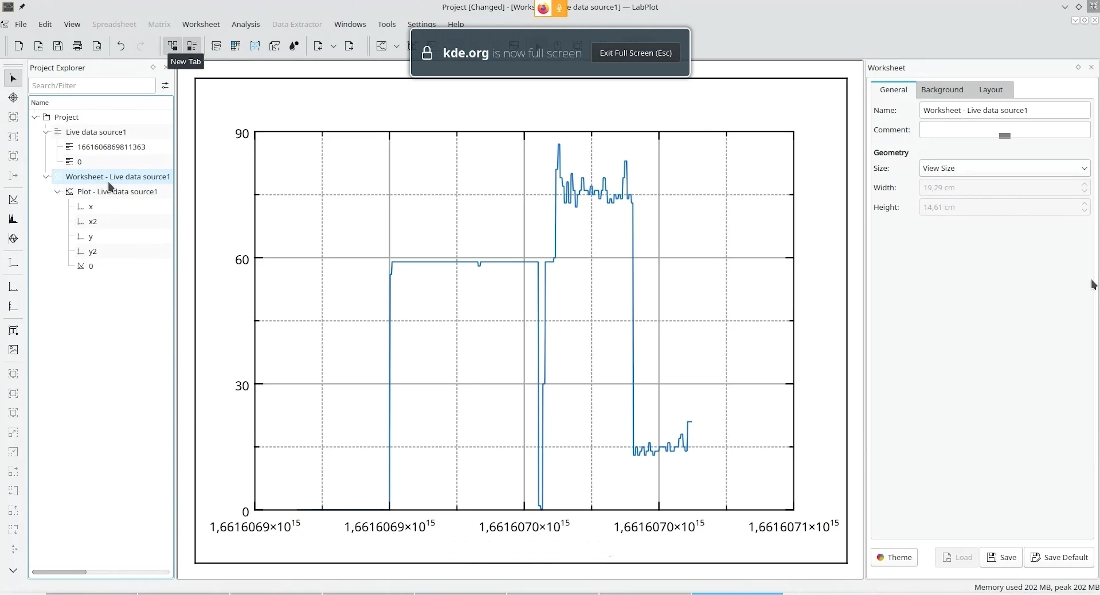
Plotting from a live data source with LabPlot during the BigBlueButton video conference (Image: CC BY-NC-ND 4.0)
Get Involved
Did you know? Discussions similar to those we had at the Sprint occur monthly at our community meetups on the 2nd Wednesday of the month from 19h to 20h (CET/CEST). Join us! We would love to see you there!
And if you cannot make it to the monthly meetups, there are many other ways to join the conversation and help make Free Software the most sustainable software.
The community is at the heart of the work of KDE and KDE Eco. Without you none of this would be possible -- again, a big thank you to everyone who joined us! What we do is possible because of the support of KDE e.V. as well as BMUV/UBA, who financially support the BE4FOSS project.
Funding Notice
The BE4FOSS project was funded by the Federal Environment Agency and the Federal Ministry for the Environment, Nature Conservation, Nuclear Safety and Consumer Protection (BMUV). The funds are made available by resolution of the German Bundestag.
The publisher is responsible for the content of this publication.
Article contributed by Joseph P. De Veaugh-Geiss under the CC-BY-SA-4.0 license.